
Website Conversion Drop Alert System
Detect Meaningful Declines in Website Conversion Before Lost Opportunities Accumulate
A business website can continue receiving normal traffic while producing fewer leads, bookings, signups or purchases. The decline may begin after a website change, a shift in visitor behavior, a problem on an important page or a gradual reduction in conversion performance.
The Website Conversion Drop Alert System monitors a defined website conversion rate against its normal performance and flags meaningful declines for investigation.
The purpose is not to assume that every decline indicates a website problem. Conversion rates naturally fluctuate, and traffic mix, seasonality, promotions and other factors can influence results. The system provides an early warning so the business can investigate before a sustained decline remains unnoticed.
Which Stax Fits Your Business
| Business Need | Stax | Software | Cost |
|---|---|---|---|
| Direct conversion monitoring using existing website analytics | Starter Stax | Google Analytics 4 | Free |
| Conversion monitoring with automated alerts and broader KPI visibility | Growth Stax | Databox | Varies by plan and usage |
| Funnel analysis connected with behavioral evidence | Pro Stax | Microsoft Clarity | Free |
Pricing and capabilities change over time and should be confirmed directly with each software provider before purchase.
Software Linx
Starter: Google Analytics
Growth: Databox
Pro: Microsoft Clarity
Blueprint Overview
| Metric | Value |
|---|---|
| Category | Marketing |
| Business Problem | Website traffic continues while conversion performance declines without timely detection |
| Primary Objective | Identify meaningful conversion rate declines early enough for investigation |
| Core Signals | Sessions, key events, leads, bookings, signups, purchases and conversion rate |
| Setup Time | Approximately 45 to 90 minutes |
| Difficulty | Intermediate |
| Maintenance | Weekly review with periodic tracking validation |
| Best For | Businesses that rely on their website to generate measurable customer actions |
| Primary Output | Conversion decline alert and investigation trigger |
The Hidden Revenue Leak
| Without This Blueprint | With This Blueprint |
|---|---|
| Conversion decline may remain unnoticed | Meaningful declines can trigger investigation |
| Traffic can make website performance appear healthy | Conversion outcomes receive separate attention |
| Problems may be discovered during later reporting | Performance changes can surface earlier |
| Website changes may lack outcome monitoring | Conversion trends provide additional context |
| Normal variation can be confused with a problem | Historical performance provides a baseline |
| Investigation begins after opportunities accumulate | Review can begin closer to the initial decline |
Google Analytics allows businesses to define important website actions as key events and provides custom insights that can evaluate metrics hourly, daily, weekly or monthly. Conditions can use fixed thresholds or anomaly detection, with optional email notifications when an insight triggers. Google Help
Business Impact Snapshot
| Area | Potential Impact |
|---|---|
| Lead Generation | Declining website lead performance can surface earlier |
| Ecommerce | Purchase conversion changes become easier to identify |
| Booking | Reduced booking completion can trigger investigation |
| Website Management | Changes can be reviewed against conversion outcomes |
| Marketing | Traffic and conversion performance remain distinguishable |
| Management | Website performance receives a repeatable monitoring process |
Real World Example
A service business normally receives 2,000 website sessions per month and generates approximately 100 qualified inquiries.
Its typical visitor to inquiry conversion rate is therefore about 5%.
Traffic remains near its normal level during the following month, but inquiries fall to 60. The conversion rate has declined to approximately 3%.
Because traffic remains stable, a traffic report alone may not make the problem obvious.
The Website Conversion Drop Alert System identifies the change in conversion performance and triggers an investigation.
The business can then examine traffic sources, devices, landing pages, website changes, user behavior and conversion tracking before deciding what caused the decline.
The alert identifies a change. It does not establish the cause.
WIZESTAX Stax Options
Starter Stax
Google Analytics 4
Best For
Businesses that already use Google Analytics and want to monitor important website actions without introducing another analytics platform.
| Function | Software |
|---|---|
| Website Analytics | Google Analytics 4 |
| Conversion Actions | Key Events |
| Performance Monitoring | Analytics Reports |
| Change Detection | Custom Insights |
| Anomaly Detection | Analytics Intelligence |
| Notifications | Insight Email Alerts |
Google Analytics allows important business actions to be represented by events and designated as key events. Analytics Intelligence provides automated insights for unusual changes and custom insights based on conditions defined by the business. Google Help
Advantages
| Benefit |
|---|
| Can build on analytics many businesses already use |
| Important website actions can be defined explicitly |
| Custom insights can monitor selected metrics |
| Anomaly based conditions can reduce reliance on one fixed threshold |
| Email notifications can accompany triggered custom insights |
Limitations
| Limitation |
|---|
| Correct event configuration is essential |
| Analytics identifies a change but may not explain its cause |
| Traffic composition can influence conversion rates |
| Small datasets can produce substantial percentage swings |
| Human investigation remains necessary |
Growth Stax
Databox
Best For
Businesses that want website conversion monitoring alongside other marketing and business KPIs with configurable alerts.
| Function | Software |
|---|---|
| Analytics Monitoring | Databox |
| Data Connections | Databox Integrations |
| Conversion Metrics | Calculated Metrics |
| Threshold Monitoring | Manual Alerts |
| Anomaly Monitoring | Smart Alerts |
| Notifications | Email, Mobile Or Slack |
Databox supports calculated metrics such as conversion rates and allows those metrics to be tracked over time. Its current notification system supports manually defined thresholds as well as Smart Alerts designed to identify statistically unusual changes based on historical patterns. Databox
Advantages
| Benefit |
|---|
| Conversion metrics can be monitored with other business KPIs |
| Alerts can use defined thresholds |
| Smart Alerts can identify unusual changes |
| Historical comparisons provide additional context |
| Notifications can reduce dependence on manually checking dashboards |
Limitations
| Limitation |
|---|
| Advanced functionality varies by subscription |
| Data quality still depends on connected sources |
| Additional setup may be unnecessary for simple websites |
| An anomaly does not establish why performance changed |
| Metric definitions must remain consistent |
Pro Stax
Microsoft Clarity
Best For
Businesses that need to investigate where visitors stop progressing after a conversion decline has been identified.
| Function | Software |
|---|---|
| Behavioral Analytics | Microsoft Clarity |
| Conversion Actions | Smart Events |
| Funnel Measurement | Funnels |
| User Behavior | Session Recordings |
| Page Interaction | Heatmaps |
| Investigation | Funnel Step Recordings |
Microsoft Clarity can define Smart Events for actions including purchases, contact requests, form submissions, quote requests and signups. Its funnels show the percentage and number of sessions progressing through each stage and allow users to move from funnel performance into related recordings and heatmaps. Microsoft Learn
Advantages
| Benefit |
|---|
| Funnel stages expose where conversion loss occurs |
| Recordings provide behavioral context |
| Heatmaps provide additional page interaction evidence |
| Smart Events can represent important website actions |
| Funnels can be created without code |
Limitations
| Limitation |
|---|
| Behavioral evidence still requires interpretation |
| Tracking must be installed on relevant pages |
| Funnel definitions must represent the actual customer journey |
| Small samples can make conversion changes appear more significant |
| Clarity is stronger for investigation than dedicated KPI alerting |
How The Three Stax Differ
| Stax | Primary Approach |
|---|---|
| Google Analytics 4 | Website event measurement with configurable conversion change detection |
| Databox | Centralized conversion KPI monitoring and automated alerts |
| Microsoft Clarity | Funnel and behavioral investigation of conversion decline |
These are different implementation architectures rather than rankings.
The appropriate architecture depends on whether the business primarily needs direct analytics monitoring, broader KPI alerts or deeper behavioral evidence about where visitors stop converting.
Copy And Paste Conversion Drop Alert
Website conversion review for {{period}}. Conversion rate declined from {{baseline_conversion_rate}} to {{current_conversion_rate}} while recorded website traffic was {{traffic_change}}. Review tracking accuracy, traffic composition, website changes, device performance and conversion behavior before determining the cause.
Copy And Paste Weekly Conversion Review
Review website conversion performance for {{period}} against the established baseline. Compare sessions, completed conversion actions and conversion rate using consistent definitions. Identify meaningful declines that require investigation and separate changes in traffic volume from changes in conversion efficiency.
Copy And Paste AI Prompt
You are assisting a small business with website conversion monitoring.
Review the website performance information provided.
Compare website sessions, completed conversion actions and conversion rate with the established historical baseline.
Identify meaningful declines in conversion performance.
Separate changes in traffic volume from changes in conversion efficiency.
Check whether the decline is concentrated by device, landing page, traffic source or conversion action where that information is available.
Consider seasonality, traffic composition and recent website changes before interpreting the decline.
Do not assume that a conversion decline was caused by the website.
Do not invent missing information.
If the available information is insufficient to identify the likely source of the decline, state what additional information is required.
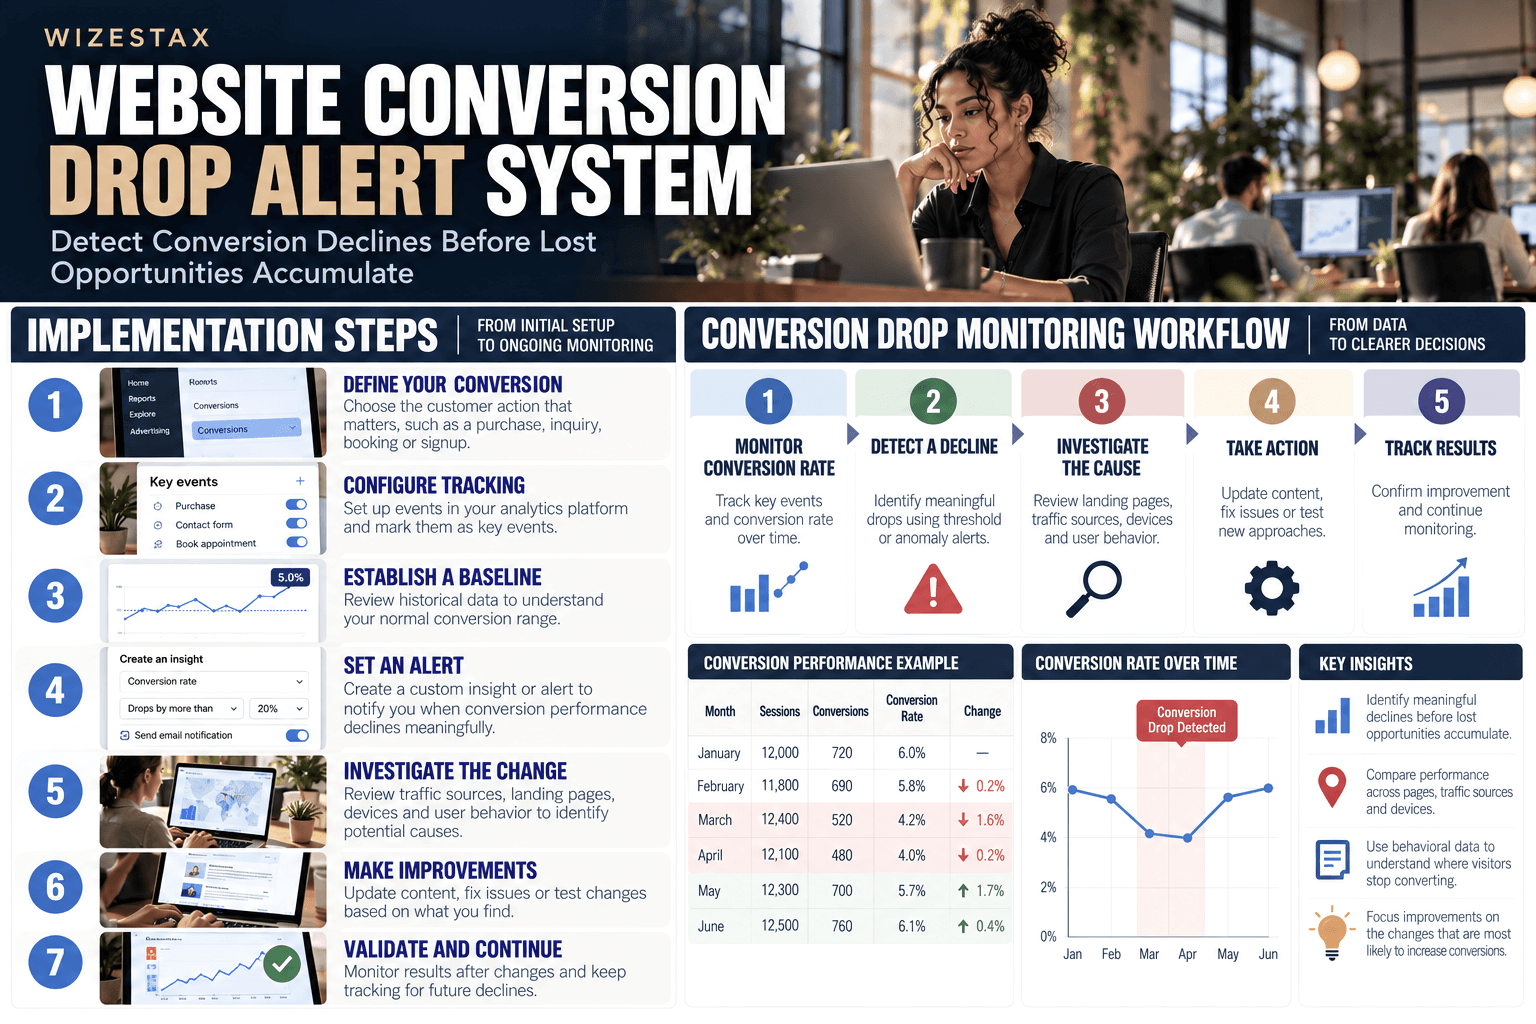
Step By Step Implementation Guide
The following setup demonstrates one implementation path using Google Analytics 4.
It is not a WIZESTAX recommendation or preferred Stax.
Google Analytics is used here because key events and custom insights provide a relatively direct architecture for defining an important website action, monitoring performance and generating a notification when a defined condition occurs. Google Help
Step 1: Define The Website Conversion
Choose the customer action that represents meaningful website success.
Depending on the business, this might be a completed purchase, qualified inquiry, appointment booking, quote request or account signup.
Avoid treating every interaction as a conversion. The monitored action should represent an outcome the business actually values.
Step 2: Configure The Event
Confirm that the website action is recorded correctly in Google Analytics.
Google Analytics conversions originate from events. An event that represents an important business action can be designated as a key event for measurement. Google Help
Test the action before relying on it for monitoring.
Step 3: Establish The Conversion Rate
Use a consistent calculation and conversion definition.
A basic website conversion rate can be represented as:
Completed Conversion Actions ÷ Relevant Website Sessions × 100
The exact denominator should remain consistent so that historical comparisons remain meaningful.
Step 4: Establish A Baseline
Review enough historical information to understand the website’s normal conversion range.
Do not establish the baseline from an unusually strong promotion, temporary traffic surge or known website problem.
The baseline should represent ordinary operating conditions as closely as possible.
Step 5: Create The Custom Insight
Create a custom insight in Google Analytics for the metric being monitored.
Google currently allows custom insights to be evaluated hourly, daily, weekly or monthly. Conditions can use a defined percentage decrease or Google’s anomaly detection. Google Help
Choose an evaluation period appropriate for the website’s traffic volume.
A low traffic website may require a longer period before a change becomes meaningful.
Step 6: Configure The Notification
Name the insight clearly and configure the appropriate email recipients.
Google Analytics allows email notifications to be associated with custom insights. Google Help
The notification should communicate that investigation is required rather than declaring that the website is malfunctioning.
Step 7: Investigate The Decline
When the alert triggers, review the surrounding evidence.
Check tracking accuracy.
Compare traffic volume and traffic sources.
Review device differences.
Examine landing pages.
Review recent website changes.
Check individual conversion actions.
Look for changes in customer behavior.
A decline concentrated on one device or page can require a different investigation from a decline affecting the entire website.
Step 8: Add Behavioral Evidence When Necessary
If analytics confirms a meaningful decline but does not explain it, behavioral analytics can provide additional context.
Microsoft Clarity supports session recordings, heatmaps, Smart Events and funnels. Funnels show where sessions stop progressing and can connect those stages with recordings or heatmaps for further investigation. Microsoft Learn
Step 9: Validate After Changes
After a suspected problem is addressed, continue monitoring the same conversion definition.
Do not assume the intervention worked simply because the website was changed.
Compare subsequent conversion performance with the established baseline and allow enough observations for a meaningful comparison.
Website Conversion At Risk Snapshot
| Monthly Website Sessions | Normal Conversion Rate | Reduced Conversion Rate | Fewer Conversions |
|---|---|---|---|
| 1,000 | 5% | 4% | 10 |
| 5,000 | 5% | 4% | 50 |
| 10,000 | 5% | 4% | 100 |
Illustrative scenario using hypothetical conversion rates. Fewer conversions do not represent confirmed lost revenue, and actual business impact depends on customer value, traffic quality and whether the decline persists.
WIZESTAX Diagnostic Scorecard
| Category | Assessment |
|---|---|
| Economic Problem | Website traffic can continue while fewer visitors complete valuable actions |
| Signal Quality Required | High |
| Automation Potential | High |
| Human Judgment Required | High |
| Data Dependency | High |
| Scalability | High |
| Primary Value | Earlier identification of meaningful conversion deterioration |
| Primary Risk | Treating normal variation or traffic mix changes as evidence of a website problem |
Common Mistakes
| Mistake | Result |
|---|---|
| Monitoring traffic without conversion outcomes | Website activity can appear healthy while performance declines |
| Using too little historical data | Normal variation can trigger unnecessary concern |
| Changing conversion definitions | Historical comparisons become unreliable |
| Ignoring traffic composition | Different visitors can produce different conversion rates |
| Assuming the website caused the decline | Investigation is replaced by assumption |
| Failing to validate event tracking | Tracking errors can resemble real conversion changes |
| Reacting to every short term movement | Normal variation can produce unnecessary changes |
Get New WIZESTAX Blueprints Every Monday
Subscribe to receive new WIZESTAX Blueprints covering Customer Retention, Marketing, Sales, Finance and Operations directly to your inbox.