

Sales Pipeline Bottleneck Detection System
Identify Where Sales Opportunities Slow Down, Accumulate or Drop Out
A sales pipeline can look busy while opportunities are quietly getting stuck. New leads continue arriving. Calls are being made. Quotes are going out. The CRM contains dozens of open opportunities. But somewhere between first contact and closed work, movement begins to slow.
Perhaps qualified leads consistently remain in the consultation stage. Proposals accumulate while waiting for internal follow up. Opportunities move quickly through early stages but repeatedly stall during negotiation. One salesperson may have significantly more aging opportunities than another.
When businesses look only at total leads, total pipeline value or closed sales, these problems can remain hidden. The Sales Pipeline Bottleneck Detection System measures how opportunities move between stages and identifies areas where deals are accumulating, aging or dropping out at unusual rates. The objective is not to pressure every opportunity forward. It is to identify parts of the sales process that deserve investigation.
Which Stax Fits Your Business
| Business Need | Stax | Software | Cost |
|---|---|---|---|
| Connected CRM with accessible pipeline management | Starter Stax | HubSpot | Free and paid options |
| Visual deal management with focused pipeline reporting | Growth Stax | Pipedrive | Varies by plan and users |
| Deeper stage analysis across structured sales processes | Pro Stax | Zoho CRM | Varies by edition and users |
Pricing and capabilities change over time and should be confirmed directly with each provider.
Software Linx
Starter
Growth
Pro
Blueprint Overview
| Metric | Value |
|---|---|
| Category | Sales |
| Business Problem | Sales opportunities slow or accumulate at particular stages |
| Primary Objective | Detect recurring pipeline bottlenecks |
| Core Signals | Stage duration, deal volume, stage conversion, inactivity and dropouts |
| Setup Time | Approximately 60 to 120 minutes |
| Difficulty | Intermediate |
| Maintenance | Weekly or periodic review |
| Best For | Service businesses, agencies, contractors and sales teams |
| Primary Output | Pipeline bottleneck alerts and stage analysis |
The Hidden Revenue Leak
| Without This Blueprint | With This Blueprint |
|---|---|
| Pipeline value looks healthy even when deals are stalled | Stage movement provides additional context |
| Aging opportunities blend into active deals | Time within each stage becomes visible |
| Managers notice problems after sales decline | Bottlenecks can be investigated earlier |
| Dropouts are viewed individually | Recurring stage patterns become measurable |
| Salespeople rely heavily on memory | CRM activity creates a shared record |
| Process problems can resemble lead quality problems | Stage analysis helps separate different issues |
A bottleneck does not automatically mean that the sales team is performing poorly.
Longer stages may be normal for certain customers, industries, products or deal sizes. The system identifies unusual patterns for investigation rather than assigning a cause automatically.
Business Impact Snapshot
| Area | Potential Impact |
|---|---|
| Pipeline Visibility | Shows where opportunities are accumulating |
| Sales Management | Provides specific stages for investigation |
| Follow Up | Helps expose opportunities receiving insufficient activity |
| Process Design | Reveals stages that may contain unnecessary friction |
| Forecasting | Separates actively progressing deals from stalled opportunities |
| Revenue | Helps businesses investigate viable opportunities before they disappear |
Real World Example
A residential remodeling company tracks opportunities through five stages:
New Inquiry
Qualified
Consultation
Proposal Sent
Decision
Management notices that the pipeline contains $420,000 in open opportunities.
At first glance, the pipeline appears healthy.
Stage analysis shows something different.
Most new inquiries move into qualification quickly. Qualified customers also reach consultations at a normal pace.
But opportunities entering Proposal Sent remain there substantially longer than the company’s normal sales cycle.
The business investigates.
Some proposals have received follow up. Others have not. Several are waiting for requested revisions. A few have effectively gone inactive but remain classified as open opportunities.
The problem is not necessarily proposal quality.
The important discovery is that one stage contains an unusual concentration of aging opportunities.
Management can now investigate that part of the process rather than treating the entire sales pipeline as one problem.
WIZESTAX Stax Options
Starter Stax
HubSpot
Best For
Businesses that want a connected CRM and visual sales pipeline with a relatively accessible starting point.
| Function | Software |
|---|---|
| CRM | HubSpot |
| Pipeline | Deal Pipelines |
| Stage Tracking | Deal Stages |
| Activity | CRM Activity Records |
| Reporting | Sales Reporting |
| Automation | HubSpot Workflows Depending On Plan |
Advantages
| Benefit |
|---|
| Centralizes opportunities and customer records |
| Visual pipelines show where deals currently sit |
| Deal stages can reflect the actual sales process |
| Sales activity can remain connected to individual opportunities |
| Businesses can begin with relatively simple pipeline management and expand later |
HubSpot currently supports customizable deal pipelines and stages, and its pipeline management tools are designed to help businesses identify roadblocks and track sales performance. (HubSpot Knowledge Base)
Limitations
| Limitation |
|---|
| More advanced reporting and automation can depend on subscription level |
| Poor CRM data reduces the quality of pipeline analysis |
| Stage definitions must remain consistent |
| A stalled deal does not reveal the reason automatically |
| Complex sales processes may require additional configuration |
Growth Stax
Pipedrive
Best For
Businesses that want pipeline movement and deal progression to remain central to the CRM experience.
| Function | Software |
|---|---|
| Pipeline | Pipedrive |
| Deal Movement | Pipeline View |
| Progress Analysis | Deal Progress Reports |
| Conversion | Deal Conversion Reports |
| Bottleneck Analysis | Deal Duration Reports |
| Inactivity | Rotting Deals |
Advantages
| Benefit |
|---|
| Visual pipeline centers the workflow around deal movement |
| Progress reports show movement through individual stages |
| Duration reporting can reveal stages where deals remain longer |
| Conversion reports show movement between pipeline stages |
| Rotting deals can highlight opportunities without recent updates |
Pipedrive currently provides progress, conversion and duration reporting. Its duration reports specifically analyze how long deals spend in each stage to help identify bottlenecks and slowdowns. Its pipeline view also includes a Rotting feature for deals that have not been updated recently. (Pipedrive Support)
Limitations
| Limitation |
|---|
| Reporting depends on accurate stage movement |
| Different sales processes may require separate pipelines |
| Inactivity does not necessarily indicate a bad opportunity |
| Staff still need to investigate the cause of a bottleneck |
| Moving deals incorrectly can distort reporting |
Pro Stax
Zoho CRM
Best For
Businesses that want deeper stage based analysis across a structured sales process.
| Function | Software |
|---|---|
| CRM | Zoho CRM |
| Pipeline | Deal Pipelines |
| Conversion Analysis | Stage Components |
| Stagnation | Stage Analytics |
| Dropout Analysis | Stage Components |
| Delay Analysis | Stage Components |
Advantages
| Benefit |
|---|
| Stage analytics can examine movement between stages |
| Stagnation can be measured separately from normal progression |
| Dropouts can be monitored |
| Delays between stages can be analyzed |
| More structured analysis can support complex pipelines |
Zoho CRM’s current Stage Component analytics are specifically designed to measure conversion to the next stage, conversion to won, stagnation, dropouts and delays. Zoho notes that these tools can be used to investigate negative pipeline patterns such as stagnation and delayed movement. (Zoho Corporation)
Limitations
| Limitation |
|---|
| Advanced stage analytics require qualifying editions |
| More configuration can increase implementation complexity |
| Staff must use stages consistently |
| Analytics identify patterns rather than underlying causes |
| Small businesses with simple sales cycles may not need the full architecture |
How The Three Stax Differ
| Stax | Primary Approach |
|---|---|
| HubSpot | Connected CRM and general pipeline visibility |
| Pipedrive | Visual deal movement and focused pipeline reporting |
| Zoho CRM | Structured stage analytics and process monitoring |
These are different architectures rather than rankings.
The appropriate setup depends on the complexity of the sales cycle, number of opportunities, existing CRM, reporting requirements and how much stage analysis the business actually needs.
Copy And Paste Bottleneck Alert
“Sales pipeline warning. {{pipeline_stage}} currently contains {{deal_count}} open opportunities with an average stage duration of {{average_duration}}. Review aging opportunities, recent activity, next actions and stage conversion before determining whether a process bottleneck exists.”
Copy And Paste Internal Review
“Pipeline review needed for {{pipeline_stage}}. Check opportunities that have exceeded the normal stage duration, confirm recent customer activity, identify missing next actions and determine whether the slowdown reflects customer timing, internal process friction or outdated CRM records.”
Copy And Paste AI Prompt
You are assisting a small business with sales pipeline analysis.
Review the provided opportunity and stage data and identify potential bottlenecks.
Compare deal volume, stage duration, conversion, inactivity and dropouts across the sales process.
Separate individual stalled opportunities from recurring stage level patterns.
Do not assume that a long stage duration means the salesperson performed poorly.
Do not assume that every inactive opportunity should receive immediate follow up.
Identify which stages deserve investigation and explain which observable signals caused them to be flagged.
Consider differences in deal size, sales cycle and customer type when that information is available.
Do not invent missing customer activity or reasons for lost opportunities.
If the data does not establish why a bottleneck exists, state that additional investigation is required.
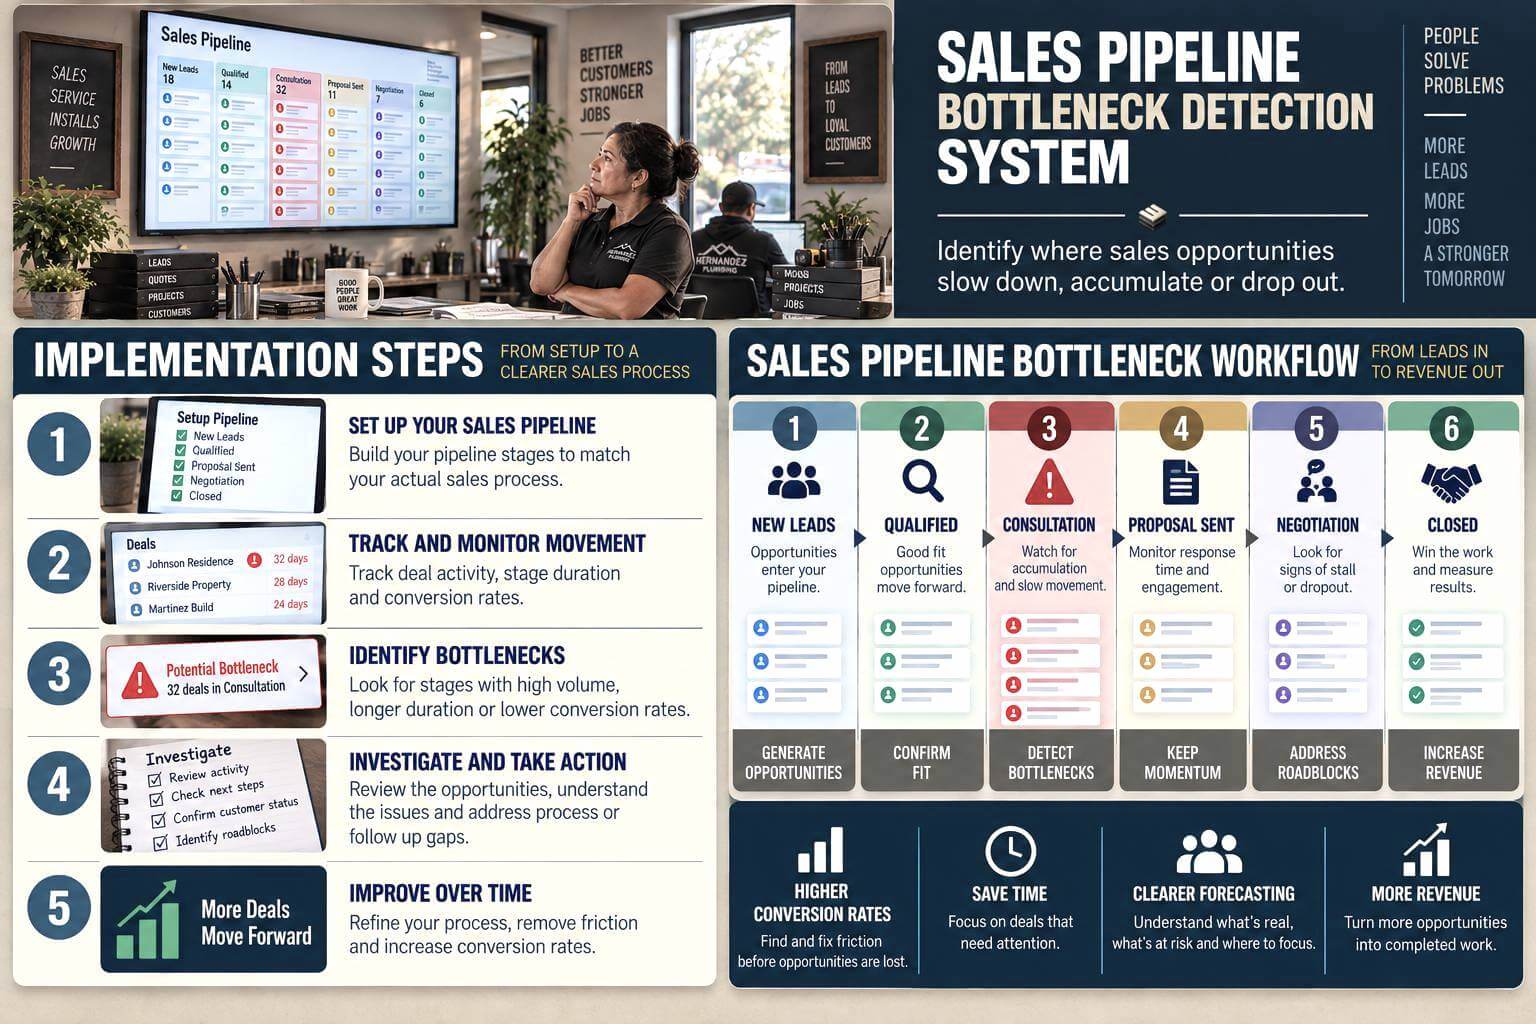
Step By Step Implementation Guide
The following setup demonstrates one implementation path using Pipedrive.
It is not a WIZESTAX recommendation or preferred Stax.
Pipedrive is used because its current reporting separates deal progress, conversion and duration, making it a clear example of how pipeline movement can be analyzed. (Pipedrive Support)
Step 1: Define The Real Sales Process
List the major steps an opportunity actually moves through.
For example:
New Lead
Qualified
Consultation
Proposal Sent
Decision
Won
Lost
Avoid adding stages simply because the CRM allows them.
Each stage should represent a meaningful change in the opportunity.
Pipedrive similarly advises businesses to align pipeline stages with the actual sales process and use clear, action oriented stages. (Pipedrive Support)
Step 2: Establish Normal Stage Duration
Review historical opportunities and determine approximately how long successful deals normally remain within each stage.
Different stages may have very different baselines.
Qualification may normally take one day.
Consultation scheduling may take four days.
Proposal review may take ten days.
Do not apply one universal aging threshold across the entire pipeline.
Step 3: Track Opportunity Movement
Move each opportunity when the underlying sales condition actually changes.
Avoid advancing deals simply to make the pipeline look healthier.
Record activities and next actions consistently.
Pipedrive’s pipeline model tracks opportunities as deals moving through defined stages until they reach a won or lost outcome. (Pipedrive Support)
Step 4: Build Pipeline Reports
Create reports for:
Deal progress
Stage conversion
Deal duration
Open opportunities by stage
Lost opportunities by stage
Pipedrive’s current Insights reports allow businesses to analyze movement, conversion and duration across the pipeline. (Pipedrive Support)
Step 5: Flag Potential Bottlenecks
Look for stages showing unusual patterns.
Examples include:
Large concentrations of open opportunities
Increasing average stage duration
Falling progression into the next stage
Repeated inactivity
Higher than normal dropout
These signals indicate where investigation should begin.
They do not establish the cause.
Step 6: Review The Deals Behind The Number
Open the opportunities contributing to the bottleneck.
Check recent activity.
Review customer communication.
Confirm whether the deal is still active.
Check whether a next action exists.
Determine whether internal work is outstanding.
Pipedrive’s deal detail view includes the opportunity’s status, activities and progress information, including time associated with its stages. (Pipedrive Support)
Step 7: Correct The Process
Once the cause is understood, the business can decide what needs to change.
That could mean clearer qualification criteria, faster proposal preparation, better ownership of follow up, simpler approvals or cleaning inactive opportunities from the pipeline.
The correction should address the observed cause rather than merely forcing deals into another stage.
Revenue At Risk Snapshot
| Opportunities Stalled | Average Deal Value | Pipeline Value Represented |
|---|---|---|
| 5 | $5,000 | $25,000 |
| 10 | $5,000 | $50,000 |
| 20 | $5,000 | $100,000 |
Illustrative scenario only. Pipeline value represented is not guaranteed revenue or recoverable revenue.
WIZESTAX Diagnostic Scorecard
| Category | Assessment |
|---|---|
| Economic Problem | Opportunities can accumulate inside inefficient sales stages |
| Signal Quality Required | High |
| Automation Potential | Moderate To High |
| Human Judgment Required | High |
| Data Dependency | High |
| Scalability | High |
| Primary Value | Visibility into where sales movement slows |
| Primary Risk | Treating normal customer timing as a sales process failure |
Common Mistakes
| Mistake | Result |
|---|---|
| Creating too many pipeline stages | Movement becomes difficult to interpret |
| Leaving inactive deals open indefinitely | Pipeline value becomes misleading |
| Using the same aging threshold everywhere | Normal stages generate false warnings |
| Moving deals without meaningful progress | Reporting becomes unreliable |
| Blaming staff immediately | Process or customer factors may be overlooked |
| Measuring only total pipeline value | Bottlenecks remain hidden |
| Fixing the stage before investigating the deals | The business may solve the wrong problem |