

Marketing Channel Waste Detection System
Identify Marketing Channels Consuming Budget Without Producing Enough Business Value
Small businesses can continue spending money on a marketing channel long after its performance has weakened. Paid search may keep generating clicks while qualified leads decline. Social campaigns may produce engagement without enough customers. Email may generate traffic that rarely converts. Another channel may appear expensive at first glance but consistently contributes to purchases later in the customer journey.
The Marketing Channel Waste Detection System brings channel cost and business outcomes together so the business can identify where marketing resources may be producing insufficient value.
The purpose is not to automatically eliminate the channel with the weakest surface level metric. Attribution, sales cycles, customer value and assisted conversions can change how a channel should be interpreted. Google Analytics, for example, provides attribution reporting specifically because several marketing interactions can contribute to the same conversion. (Google Help)
Which Stax Fits Your Business
| Business Need | Stax | Software | Cost |
|---|---|---|---|
| Centralized monitoring across several marketing platforms | Starter Stax | Databox | Varies by plan and usage |
| Deeper analysis using blended marketing and business data | Growth Stax | Zoho Analytics | Varies by plan and users |
| Marketing attribution connected directly with CRM and revenue activity | Pro Stax | HubSpot Marketing Hub | Varies by edition and users |
Pricing and capabilities change over time and should be confirmed directly with each software provider before purchase.
Software Linx
Starter: Databox
Growth: Zoho Analytics
Blueprint Overview
| Metric | Value |
|---|---|
| Category | Marketing |
| Business Problem | Marketing resources continue flowing into channels without enough visibility into their business contribution |
| Primary Objective | Identify channels showing meaningful evidence of inefficient spending |
| Core Signals | Channel spend, leads, customers, conversions, revenue and acquisition trends |
| Setup Time | Approximately 60 to 120 minutes |
| Difficulty | Intermediate |
| Maintenance | Monthly review with periodic validation |
| Best For | Businesses investing across multiple marketing channels |
| Primary Output | Channel efficiency status and investigation trigger |
The Hidden Revenue Leak
| Without This Blueprint | With This Blueprint |
|---|---|
| Marketing budgets continue largely from habit | Channel performance is reviewed against defined outcomes |
| Traffic and engagement can dominate reporting | Business outcomes receive greater context |
| Costs remain separated across platforms | Marketing spending can be viewed together |
| Weak performance may remain unnoticed | Material changes can trigger investigation |
| Channels are judged using different standards | Consistent measures improve comparison |
| Budget changes rely heavily on intuition | Decisions have a repeatable analytical baseline |
A weak channel should not automatically be shut down. Some channels contribute earlier in the buying journey and may assist conversions that another channel eventually receives credit for. Google Analytics provides attribution paths and model comparisons specifically to examine those interactions. (Google Help)
Business Impact Snapshot
| Area | Potential Impact |
|---|---|
| Marketing Spend | Inefficient spending becomes easier to identify |
| Budget Allocation | Resources can be reviewed using consistent evidence |
| Channel Visibility | Marketing activity can be compared in one operating view |
| Customer Acquisition | Channels can be evaluated against customer outcomes |
| Management | Marketing review becomes a repeatable process |
| Planning | Budget changes can be investigated before the next spending cycle |
Real World Example
A local business spends money across paid search, social advertising, email and local marketing.
One channel receives $2,000 during the month and generates substantial website traffic. Another receives only $1,000 and produces considerably less traffic.
Judged on traffic alone, the first channel appears stronger.
After customer outcomes are connected, however, the business discovers that the lower traffic channel contributes more qualified leads and paying customers.
The system does not automatically label either channel good or bad.
Instead, it identifies the difference between marketing activity and business outcomes so the owner can investigate whether the current allocation still makes sense.
WIZESTAX Stax Options
Starter Stax
Databox
Best For
Businesses that already use several marketing platforms and primarily need one place to monitor channel performance and calculated efficiency metrics.
| Function | Software |
|---|---|
| Marketing Dashboard | Databox |
| Data Connections | Databox Integrations |
| Performance Metrics | Custom Metrics |
| Efficiency Calculations | Calculated Metrics |
| Monitoring | Databoards And Alerts |
Databox currently supports connections across advertising, analytics, CRM, ecommerce and other business systems. Its calculated metrics can combine information from different sources to calculate measures such as ROAS, conversion rates and CAC. (Databox)
Advantages
| Benefit |
|---|
| Multiple marketing sources can appear in one dashboard |
| Calculated metrics can provide additional efficiency context |
| Existing marketing tools do not necessarily need to be replaced |
| Trends can be monitored over time |
| Alerts can surface meaningful performance changes |
Limitations
| Limitation |
|---|
| Accurate analysis depends on accurate source data |
| Business outcomes must still be connected properly |
| Dashboard visibility does not establish causation |
| Available integrations and functionality depend on the plan |
| Human review remains necessary before changing budgets |
Growth Stax
Zoho Analytics
Best For
Businesses that need to combine marketing platform information with broader CRM, financial or operational data for deeper channel analysis.
| Function | Software |
|---|---|
| Business Intelligence | Zoho Analytics |
| Marketing Data | Marketing Connectors |
| Website Analytics | GA4 Connector |
| Advertising Analysis | Advertising Connectors |
| Reporting | Dashboards And Reports |
| Cross Source Analysis | Data Blending |
Zoho Analytics provides marketing integrations across sources including Google Analytics, Google Ads, Search Console and several social and advertising platforms. Its marketing analytics environment is designed to bring those sources into a combined reporting layer. (Zoho Corporation)
Advantages
| Benefit |
|---|
| Marketing information can be blended across systems |
| Advertising and website activity can be analyzed together |
| Custom reporting allows businesses to define relevant efficiency measures |
| Historical channel patterns can be compared |
| Broader business data can provide context beyond marketing activity |
Limitations
| Limitation |
|---|
| Requires more setup than a simple dashboard |
| Channel definitions must remain consistent |
| Data connections depend on available integrations |
| Poor source data produces poor analysis |
| Attribution still requires careful interpretation |
Pro Stax
HubSpot Marketing Hub
Best For
Businesses that want marketing activity, contacts, deals and revenue connected within the same customer lifecycle environment.
| Function | Software |
|---|---|
| CRM | HubSpot Smart CRM |
| Marketing | Marketing Hub |
| Campaign Management | HubSpot Campaigns |
| Attribution | Campaign Attribution Reports |
| ROI Analysis | Campaign ROI |
| Revenue Context | Deals And Revenue |
HubSpot’s current campaign attribution reporting can analyze contacts created, deals created and, on qualifying plans, revenue attributed to campaigns. Its campaign ROI tools can also calculate effectiveness using revenue, associated deal value or attributed revenue depending on subscription level. (HubSpot Knowledge Base)
Advantages
| Benefit |
|---|
| Marketing activity remains connected with customer records |
| Campaigns can be examined against downstream outcomes |
| Attribution provides more context than last touch reporting alone |
| Revenue can become part of marketing analysis |
| Suitable for businesses with more complex customer journeys |
Limitations
| Limitation |
|---|
| Advanced attribution capabilities require qualifying plans |
| Higher complexity than many small businesses need |
| External marketing costs may still require additional data |
| Attribution results depend on tracking quality |
| No attribution model provides perfect knowledge of why a customer purchased |
How The Three Stax Differ
| Stax | Primary Approach |
|---|---|
| Databox | Centralized channel monitoring and calculated performance metrics |
| Zoho Analytics | Cross system marketing and business intelligence |
| HubSpot Marketing Hub | CRM connected campaign, attribution and revenue analysis |
These are different implementation architectures rather than rankings.
The appropriate architecture depends on where the business currently stores its marketing data, whether customer and revenue information can be connected to that activity, and how sophisticated the customer journey actually is.
Copy And Paste Marketing Waste Alert
Marketing channel review for {{channel_name}}. During {{period}}, measured marketing cost was {{channel_cost}} and recorded business outcomes were {{channel_outcomes}}. Performance has moved outside the expected range. Review tracking accuracy, lead quality, customer outcomes and attribution context before changing the budget.
Copy And Paste Monthly Channel Review
Review marketing performance for {{period}} using the same channel definitions and measurement rules as the previous period. Identify meaningful changes in spending, qualified leads, customers and revenue. Flag channels that require investigation, but do not automatically classify the weakest metric as wasted spending.
Copy And Paste AI Prompt
You are assisting a small business with marketing channel efficiency analysis.
Review the marketing information provided across each channel.
Compare channel spending with relevant business outcomes including qualified leads, customers, conversions and revenue where available.
Identify channels where spending has increased without a corresponding improvement in meaningful outcomes.
Separate traffic, impressions and engagement from actual business outcomes.
Consider attribution and assisted customer journeys before treating a channel as ineffective.
Use consistent periods and definitions when comparing channels.
Do not assume that the most expensive channel is inefficient.
Do not assume that the channel receiving final conversion credit created the entire customer journey.
Do not invent missing information.
If the available information is insufficient to determine whether spending is inefficient, state what additional information is required.
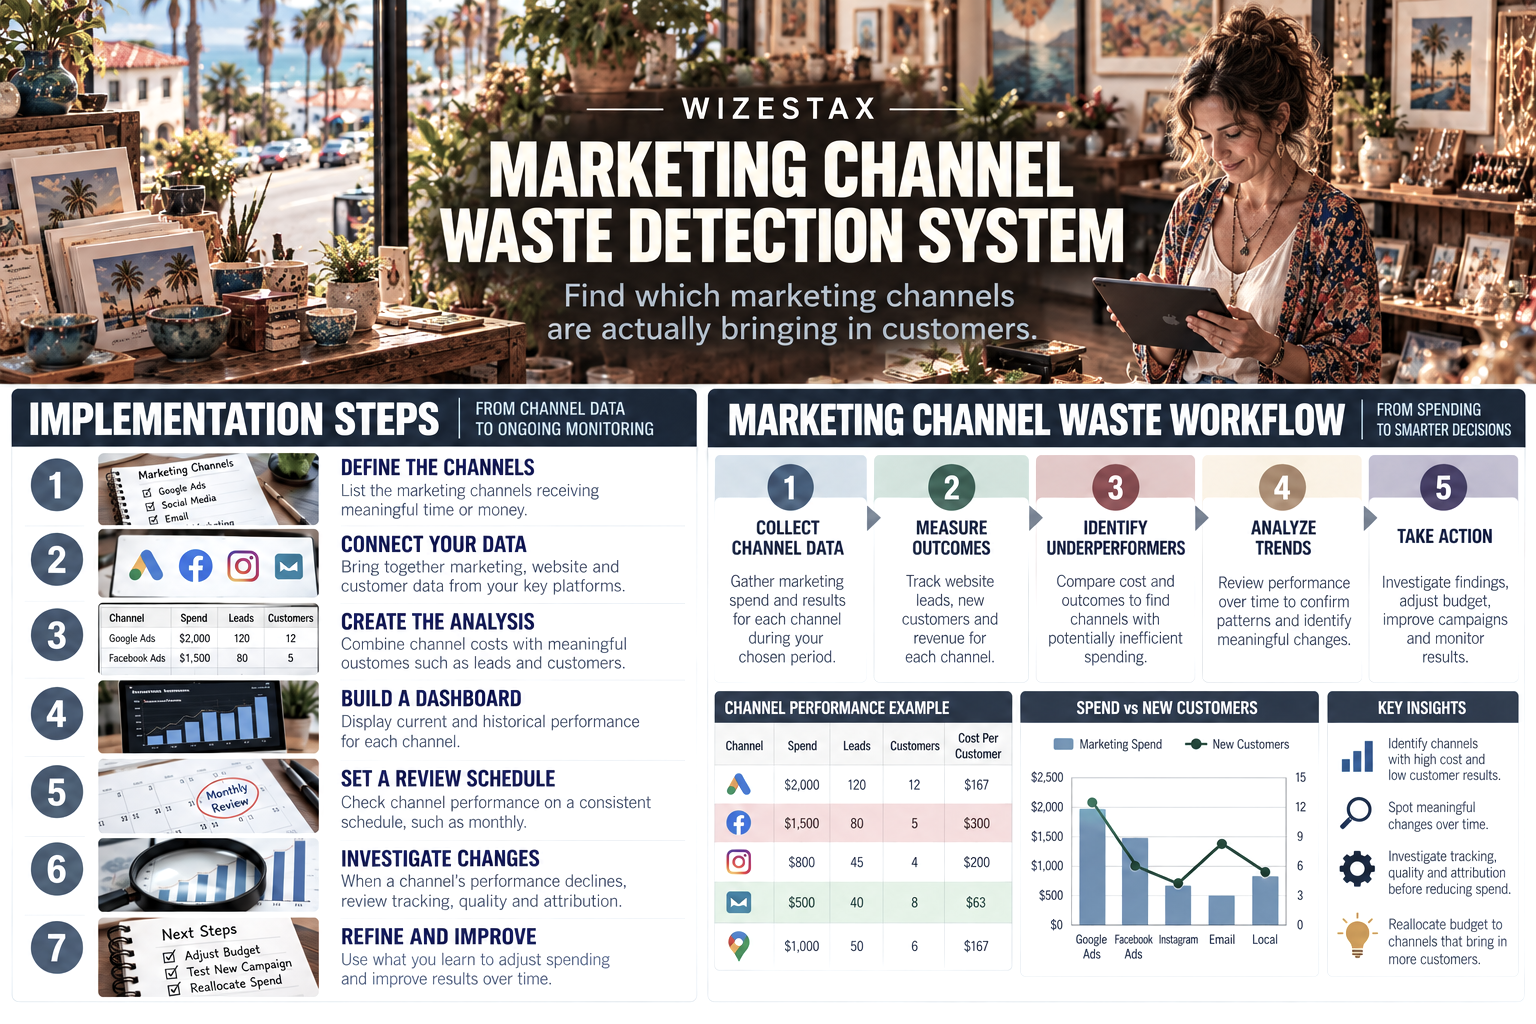
Step By Step Implementation Guide
The following setup demonstrates one implementation path using Databox.
It is not a WIZESTAX recommendation or preferred Stax.
Databox is used here because its integrations and calculated metrics provide a relatively direct example of bringing several marketing sources into one monitoring environment. Databox currently supports marketing, advertising, CRM, ecommerce and financial integrations, while calculated metrics can combine values from different sources. (Databox)
Step 1: Define The Channels
List the marketing channels receiving meaningful time or money.
Examples might include paid search, paid social, email, organic search, local marketing and referral programs.
Do not create separate categories simply because one platform contains several individual campaigns. Start at a level where budget decisions are actually made.
Step 2: Define Meaningful Outcomes
Decide which outcomes indicate that marketing is contributing to the business.
Depending on the business, these might include qualified leads, booked appointments, completed purchases, new customers or revenue.
Traffic and engagement can remain supporting metrics, but they should not automatically become the definition of success.
Step 3: Connect The Data Sources
Connect the relevant marketing and business systems to Databox.
Databox currently lists integrations including Google Analytics 4, Google Ads, Facebook Ads, LinkedIn Ads, HubSpot, Pipedrive, Shopify, Stripe, QuickBooks and other platforms. (Databox)
Step 4: Build The Channel View
Create a consistent view for each channel containing the measures that matter to the business.
A basic channel view could include:
Marketing Spend
Qualified Leads
New Customers
Revenue
Cost Per Qualified Lead
Customer Acquisition Cost
Return On Ad Spend
Not every business needs every measure. The purpose is consistency, not dashboard complexity.
Step 5: Establish A Review Baseline
Collect enough normal performance data to understand how each channel typically behaves.
A channel should not be classified as waste simply because one week or month underperforms.
Seasonality, campaign launches, long sales cycles and changes in customer behavior can create temporary variation.
Step 6: Flag Meaningful Changes
Create a review trigger when a channel moves materially outside its normal range.
Examples include spending increasing while qualified leads decline, customer acquisition cost rising materially, or substantial traffic continuing without corresponding customer outcomes.
The alert should trigger investigation rather than automatic budget reduction.
Databox supports alerts around metric changes and goals, allowing calculated performance measures to participate in ongoing monitoring. (Databox)
Step 7: Investigate Before Reallocating
When a channel is flagged, review:
Tracking accuracy
Campaign changes
Audience changes
Lead quality
Conversion behavior
Customer value
Attribution paths
Only after that review should the business decide whether to maintain, modify, increase or reduce the channel.
Google’s attribution documentation reinforces why this matters: customers may interact with several ads or channels before completing an important action, and attribution models distribute credit differently across those touchpoints. (Google Help)
Marketing Spend At Risk Snapshot
| Monthly Channel Spend | Potentially Inefficient Portion | Spend Requiring Review |
|---|---|---|
| $2,500 | 10% | $250 |
| $5,000 | 10% | $500 |
| $10,000 | 10% | $1,000 |
Illustrative scenario using a hypothetical 10% portion of marketing spend requiring investigation. Spend requiring review is not confirmed waste and does not represent guaranteed savings.
WIZESTAX Diagnostic Scorecard
| Category | Assessment |
|---|---|
| Economic Problem | Marketing resources can continue flowing into channels without enough evidence of business contribution |
| Signal Quality Required | High |
| Automation Potential | Moderate To High |
| Human Judgment Required | High |
| Data Dependency | High |
| Scalability | High |
| Primary Value | Earlier identification of potentially inefficient marketing spending |
| Primary Risk | Incorrectly cutting channels because attribution or outcome tracking is incomplete |
Common Mistakes
| Mistake | Result |
|---|---|
| Treating clicks as customers | Activity can be mistaken for business value |
| Judging every channel by one metric | Different roles in the customer journey are ignored |
| Comparing inconsistent periods | Normal timing differences appear meaningful |
| Ignoring assisted conversions | Supporting channels can appear ineffective |
| Automatically cutting flagged channels | Investigation is replaced by reaction |
| Using incomplete cost information | Channel efficiency can be overstated |
| Never validating tracking | Bad data produces misleading conclusions |
Get New WIZESTAX Blueprints Every Monday
Subscribe to receive new WIZESTAX Blueprints covering Customer Retention, Marketing, Sales, Finance and Operations directly to your inbox.