
Underpriced Service Detection System
Identify Services That Consistently Generate Too Little Margin Before Weak Pricing Becomes A Repeating Profit Leak
A business can stay busy, keep customers happy, and generate steady revenue while certain services quietly produce very little profit. The problem is often difficult to see because the individual jobs may not look disastrous. The work gets completed. The customer pays. Revenue enters the business. But when the actual labor, materials, travel, equipment, subcontractor costs, and other direct expenses are compared against what the business charges, the same service may repeatedly produce margins below what the business expected.
The Underpriced Service Detection System looks for that repeated pattern. Instead of evaluating one bad job, it groups completed jobs by service and compares their actual economics over time. When the same service repeatedly produces weak margins, the system flags the pricing structure for human review. The system does not automatically raise prices. It identifies where the economics deserve investigation.
Which Stax Fits Your Business?
| Business Environment | Stax | Primary Strength |
|---|---|---|
| Small service business | Jobber | Service pricing combined with actual job costing |
| Accounting centered business | QuickBooks Online | Historical project revenue and expense analysis |
| Complex field service operation | ServiceTitan | Pricebook, costing and pricing analysis |
Software Linx
Starter Stax: Jobber
Growth Stax: QuickBooks Online
Pro Stax: ServiceTitan
Blueprint Overview
| Category | Details |
|---|---|
| Category | Pricing And Profitability |
| Business Problem | Services repeatedly generate less margin than their pricing was intended to support |
| Primary Objective | Identify recurring service level pricing problems |
| Core Signal | Actual service costs repeatedly produce margins below an approved threshold |
| Setup Time | Approximately 90 To 180 Minutes |
| Difficulty | Intermediate |
| Maintenance | Requires accurate service, revenue and cost records |
| Best For | Contractors, repair businesses, home services, agencies, consultants and recurring service companies |
| Primary Output | Internal service pricing review alert |
The Hidden Revenue Leak
Underpricing becomes dangerous when it repeats.
One unusually expensive job may be an operational problem.
Twenty similar jobs producing weak margins may reveal something different.
Imagine a business charges $500 for a particular service.
Its original pricing assumptions were:
Labor: $180
Materials: $100
Other Direct Costs: $40
That leaves $180 before overhead and other business expenses.
But completed job data begins showing something different.
Average labor is now $230.
Average materials are $125.
Other direct costs average $45.
The service is still producing revenue.
Customers may still be buying it regularly.
But the economics underneath the price have changed.
Without service level analysis, that leak can remain hidden inside otherwise healthy revenue.
Business Impact Snapshot
| Area | Potential Impact |
|---|---|
| Gross Profit | Revenue does not adequately cover direct service costs |
| Labor | Actual labor requirements exceed pricing assumptions |
| Materials | Rising input costs reduce expected margin |
| Capacity | Low margin services consume time that could support stronger work |
| Growth | Selling more of an underpriced service can magnify the problem |
| Cash Flow | Revenue grows faster than economic contribution |
| Pricing | Old assumptions remain embedded in current prices |
The important distinction is repetition.
This system looks for a service level pattern, not simply an individual job that performed poorly.
Real World Example
A landscaping company sells a standard seasonal cleanup package for $750.
The service was originally priced around:
Labor: $280
Disposal And Materials: $120
Other Direct Costs: $50
Expected direct cost was $450.
After reviewing 25 completed cleanup jobs, the business discovers:
Average Labor Cost: $345
Average Disposal And Materials: $145
Average Other Direct Costs: $55
Average direct cost has risen to $545.
The $750 service still generates positive contribution, but considerably less than the original pricing model anticipated.
The detection system flags the service for review.
Management can now investigate whether the cause is pricing, productivity, material costs, service definition, estimating assumptions, or another factor before deciding what should change.
WIZESTAX Stax Options
Starter Stax
Jobber
Best For: Smaller service businesses that already quote, schedule, perform and cost jobs inside Jobber.
Jobber’s current job costing system calculates job profitability using employee timesheets, line item costs and job expenses. Its one off jobs report can also expose total costs, labor costs, expenses, profit and profit percentage across completed jobs. (Jobber Help Center)
| Function | Jobber Role |
|---|---|
| Service | Product And Service Line Item |
| Selling Price | Unit Price |
| Material Cost | Unit Cost And Expenses |
| Labor Cost | Timesheets |
| Job Economics | Job Costing |
| Historical Analysis | One Off Jobs Report |
Advantages
Jobber connects the service sold with much of the operational data required to understand what delivering the job actually cost.
Its quote markup functionality can also store unit cost, markup and unit price while displaying estimated margin internally during quoting. (Jobber Help Center)
That creates two useful perspectives:
Expected economics before the work
and
Actual economics after the work
Limitations
Reliable detection depends heavily on accurate time and cost records.
Jobber also warns that recording the same cost as both a line item cost and an expense can double count it and make profitability appear lower than it actually is. (Jobber Help Center)
Individual job profitability still needs to be grouped and interpreted carefully before concluding that the underlying service itself is underpriced.
Growth Stax
QuickBooks Online
Best For: Businesses that primarily investigate service economics through their accounting records.
| Function | QuickBooks Role |
|---|---|
| Revenue | Recorded customer and project income |
| Costs | Recorded project expenses |
| Historical Results | Completed project records |
| Comparison | Similar project analysis |
| Detection | Repeated weak economic performance |
| Review | Management pricing analysis |
Advantages
This architecture keeps the analysis close to the accounting system.
Businesses with disciplined project records can compare revenue and expenses across similar completed work and look for recurring economic patterns.
This can be particularly useful when the accounting system contains more complete cost information than the operational scheduling platform.
Limitations
Accounting records may not describe services consistently enough for easy comparison.
The business may need standardized service names, project classifications, or exported analysis before it can determine whether jobs are genuinely comparable.
Financial records can also reveal that margins are weak without explaining why.
Pro Stax
ServiceTitan
Best For: Larger field service businesses maintaining structured services, materials, equipment and pricing inside a centralized pricebook.
ServiceTitan’s Pricebook provides a central location for managing services, materials and equipment used throughout estimates, invoices and purchasing. (ServiceTitan)
| Function | ServiceTitan Role |
|---|---|
| Service Definition | Pricebook |
| Cost Structure | Services, materials and equipment |
| Selling Price | Pricebook and estimate pricing |
| Margin Analysis | Pricing tools and operational financial data |
| Pricing Review | Management |
| Updated Pricing | Controlled pricebook changes |
Advantages
A structured pricebook gives the business a consistent service definition against which pricing assumptions can be reviewed.
ServiceTitan also introduced a Pricing Tool in 2026 that can calculate markup and margin during estimate creation and show the relationship among cost, markup, margin, price and profit. ServiceTitan currently identifies this feature as a Private Preview available to specific accounts, so it should not be assumed to be available universally. (ServiceTitan)
Limitations
More detailed systems require stronger data governance.
If pricebook costs, labor assumptions or service definitions are outdated, the analysis can still produce misleading conclusions.
Some advanced pricing functionality also requires configuration or limited feature access. (ServiceTitan)
How The Three Stax Differ
| Stax | Detection Perspective | Best Environment |
|---|---|---|
| Jobber | Actual job costs compared with service pricing | Smaller service operations |
| QuickBooks Online | Historical financial performance across similar work | Accounting centered businesses |
| ServiceTitan | Structured pricebook and service economics | Complex field service operations |
The architecture matters less than the underlying discipline.
The business needs to know:
What service was sold
What was charged
What it actually cost to deliver
Whether the pattern repeats
Without those four pieces, an underpricing diagnosis becomes guesswork.
Copy And Paste Pricing Review Alert
Internal Alert
Pricing review required for [SERVICE].
Jobs reviewed: [NUMBER]
Current average selling price: [PRICE]
Average direct cost: [COST]
Average contribution before overhead: [CONTRIBUTION]
Current margin: [MARGIN]
Approved review threshold: [THRESHOLD]
Please review labor, materials, service scope, operational efficiency, cost assumptions and current pricing before determining whether a pricing change is appropriate.
This alert identifies an economic pattern.
It does not automatically authorize a price increase.
Copy And Paste AI Prompt
Prompt:
Analyze the following completed job data for possible service underpricing.
Use only verified service names, selling prices, labor costs, material costs, subcontractor costs, equipment costs, travel costs, other direct costs and completed job information provided.
Group genuinely comparable jobs by service.
Calculate the available economic performance for each service using the supplied records.
Look for services that repeatedly produce margins below the business’s approved review threshold.
Do not classify a service as underpriced because of one unusual job.
Do not assume every low margin job is caused by pricing.
Check for possible operational explanations including unusual labor, rework, material waste, scope changes, estimating errors or incomplete cost records.
Separate recurring service level patterns from isolated job problems.
Do not invent missing costs.
Do not determine the correct selling price.
Do not automatically recommend a price increase.
For each flagged service report:
Service
Jobs analyzed
Average selling price
Average available direct cost
Average available contribution
Margin pattern
Important cost drivers
Outliers
Missing information
Review category
If the available records are insufficient to determine whether the service has a recurring pricing problem, classify the result as requiring additional data.
The goal is to identify services whose economics repeatedly deserve pricing review without confusing operational problems with pricing problems.
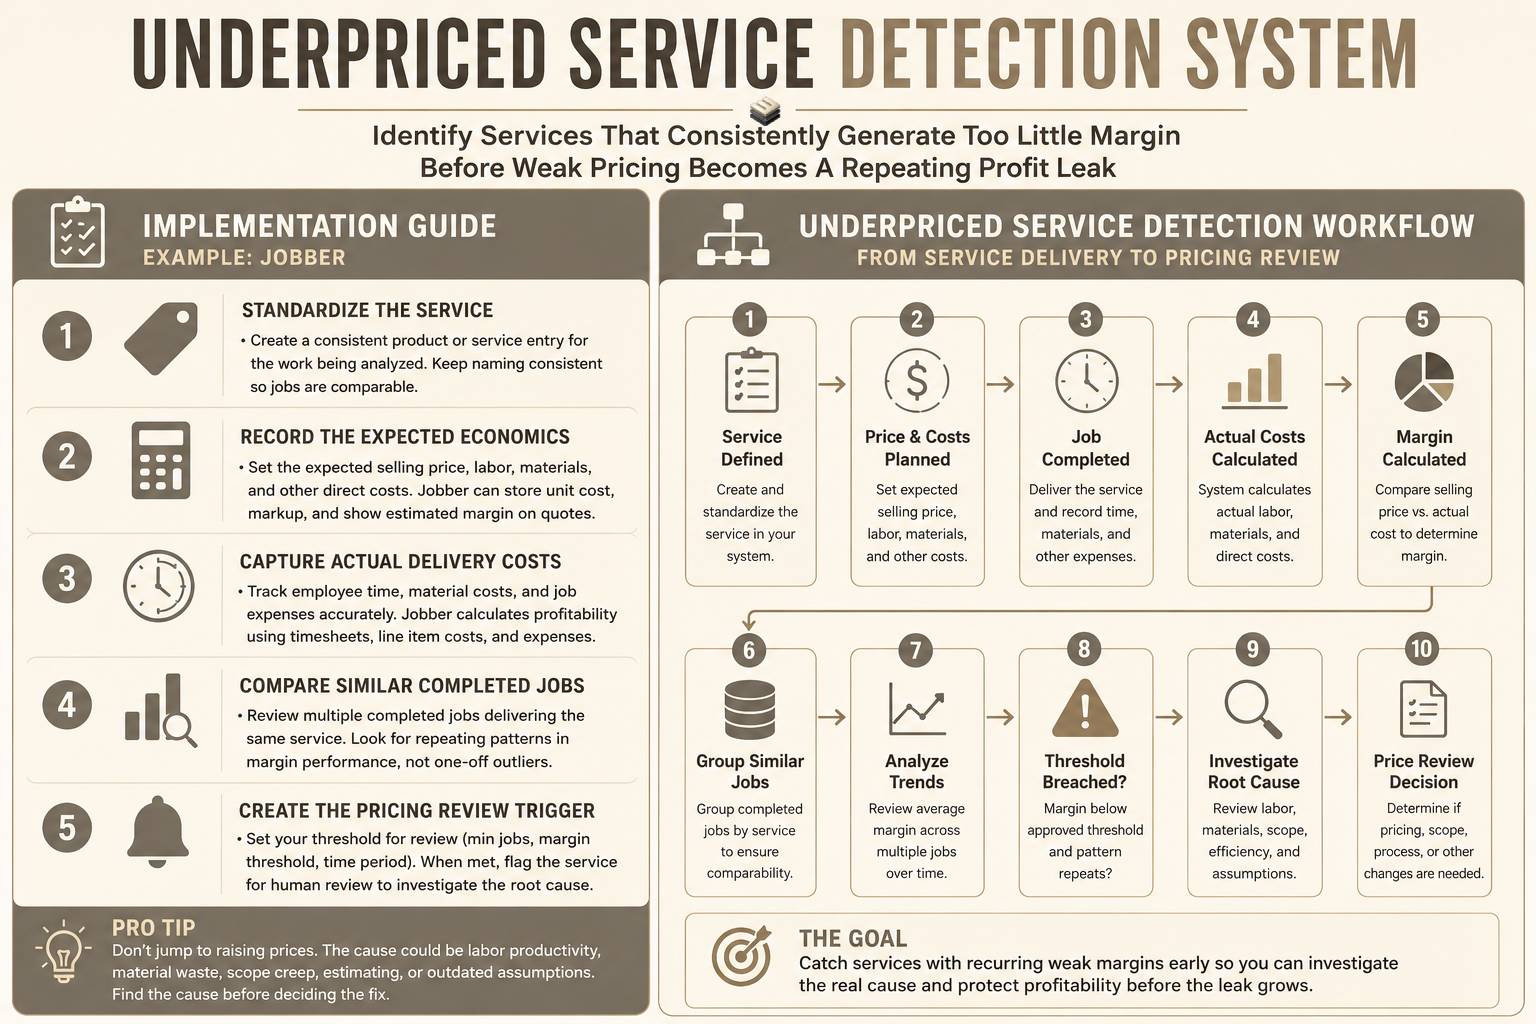
Step By Step Implementation Guide
Example Implementation: Jobber
This implementation uses Jobber because its combination of quote pricing, service line items, timesheets, expenses and job costing provides a practical example of comparing expected service economics against completed job results.
It is an implementation example, not a WIZESTAX recommendation.
Step 1: Standardize The Service
Create a consistent product or service entry for the work being analyzed.
Avoid using several different names for essentially the same service unless those versions genuinely have different economics.
The goal is to make comparable jobs identifiable.
Step 2: Record The Expected Economics
For each service, establish the available expected:
Selling price
Material cost
Labor assumption
Other direct cost
Expected margin
Jobber allows line items to contain unit cost and unit price, while its quote markup functionality can display estimated margin internally. (Jobber Help Center)
Step 3: Capture Actual Delivery Costs
Require employees to track their time against the correct job.
Record material costs and other job expenses consistently.
Jobber currently calculates profitability using timesheets, line item costs and expenses. (Jobber Help Center)
The detection system becomes unreliable if those inputs are incomplete.
Step 4: Compare Similar Completed Jobs
Do not diagnose the service from a single result.
Review multiple completed jobs delivering the same service.
Compare:
Selling Price → Actual Labor → Materials → Other Direct Costs → Contribution → Margin
Then look for repetition.
If one job performs poorly while most perform normally, investigate the job.
If the service repeatedly performs poorly, investigate the service economics.
Step 5: Create The Pricing Review Trigger
Establish an internal threshold for service review.
For example:
A minimum number of completed comparable jobs
An approved margin threshold
A repeated variance requirement
A defined analysis period
When those conditions are met, flag the service for human review.
The review can then determine whether the problem involves price, cost assumptions, operations, scope, estimating, or another cause.
Pricing Leak Snapshot
Consider an illustrative service sold 40 times per year.
Average Selling Price: $800
Original Expected Direct Cost: $480
Expected Contribution: $320
Actual completed job data shows:
Average Direct Cost: $575
Actual contribution becomes:
$225
The difference is:
$95 per job
Across 40 comparable jobs:
$95 × 40 = $3,800
The business is not necessarily losing money on the service.
But the service is producing $3,800 less annual contribution than the original economics anticipated.
If the business sells more of the service without recognizing the pattern, the leak scales with volume.
These figures are illustrative only. Real pricing decisions should account for the business’s full cost structure, overhead, market conditions, strategy and financial objectives.
WIZESTAX Diagnostic Scorecard
| Diagnostic Area | Assessment |
|---|---|
| Economic Problem | Repeated service delivery economics do not support the intended pricing model |
| Data Accuracy Required | Very High |
| Automation Potential | High |
| Human Judgment Required | Very High |
| Customer Effort | None |
| Timing Dependency | Moderate |
| Financial Sensitivity | Very High |
| Scalability | Very High |
| Primary Value | Identifying recurring pricing leaks hidden inside completed work |
| Primary Risk | Mistaking operational inefficiency for underpricing |
Common Mistakes
Diagnosing From One Bad Job
One unusual project does not establish a pricing pattern.
Ignoring Labor
A service can look profitable when materials are tracked accurately but employee time is not.
Comparing Different Types Of Work
Two jobs with similar names may have substantially different scopes and economics.
Automatically Raising Prices
The system identifies a pricing review condition. It does not determine the correct response.
Ignoring Operational Problems
Poor productivity, excessive travel, rework or material waste can make an otherwise reasonable price appear inadequate.
Using Outdated Cost Assumptions
A price established years ago may still be based on labor and material economics that no longer exist.
Confusing Revenue With Profitability
A popular service can generate substantial revenue while contributing far less profit than expected.
Related WIZESTAX Categories
Job Cost Overrun Warning System
Detects an individual job consuming more resources than its planned cost.
Job Profit Margin Warning
Detects deteriorating economics on a specific job.
Scope Creep Detection System
Detects work expanding beyond what was originally approved.
Job Rework Detection
Identifies corrective work that must be performed again.
Unprofitable Customer Detection
Evaluates the economics of the broader customer relationship.
Price Increase Communication System
Communicates a pricing change after the business has already decided to make it.
Underpriced Service Detection is different.
Its specific economic leak is a repeatable service whose normal delivery economics consistently produce less margin than the business’s pricing model was intended to support. One job performing badly does not necessarily mean the service is underpriced. One customer being unprofitable does not necessarily mean the service is underpriced. And identifying an underpriced service does not automatically mean the price should increase. The system finds the recurring economic signal. Management decides what that signal means.
Find The Pricing Leak Before Selling More Of It
Growth magnifies whatever economics already exist. When a service is priced appropriately, additional volume can strengthen the business. When a service repeatedly produces inadequate contribution, additional volume can multiply the leak. The Underpriced Service Detection System gives businesses a structured way to compare what they charge with what delivering the service actually requires, identify repeated weak economics, and investigate the cause before making a pricing decision.
Subscribe to WIZESTAX for practical business system Blueprints built around specific operational and economic leaks.