
Unprofitable Customer Detection System
Identify Customer Relationships That Consume More Profit Than They Create
Revenue does not tell you whether a customer is profitable. A customer can purchase frequently, generate substantial invoices, and appear to be one of the business’s strongest accounts while quietly consuming that revenue through excessive labor, travel, discounts, materials, support requests, rework, returns, special handling, or other costs. Those relationships are difficult to identify because most businesses naturally see what the customer spends before they see what serving the customer costs.
The Unprofitable Customer Detection System connects customer revenue with the costs required to serve that customer so the business can identify relationships where margins have become weak or negative. The system does not automatically label a customer as good or bad. It creates financial visibility so an owner or manager can investigate the reason and decide whether pricing, service scope, operating processes, customer terms, or the relationship itself needs attention.
Which Stax Fits Your Business
| Business Need | Stax | Software | Cost |
|---|---|---|---|
| Job and project profitability inside the accounting system | Starter Stax | QuickBooks Online | Varies By Plan |
| CRM based customer profitability monitoring | Growth Stax | HubSpot | Varies By Hub And Plan |
| Deeper cross system profitability analysis | Pro Stax | Zoho Analytics | Varies By Plan |
Pricing and capabilities change over time and should be confirmed directly with each software provider before purchase.
Software Linx
Starter Stax
Growth Stax
Pro Stax
Blueprint Overview
| Metric | Value |
|---|---|
| Category | Finance |
| Business Problem | Customer revenue can hide the actual cost of serving the customer |
| Primary Objective | Identify customer relationships with weak or negative profitability |
| Core Signal | Customer revenue minus attributable service costs falls below an approved threshold |
| Setup Time | Approximately 90 To 180 Minutes |
| Difficulty | Intermediate |
| Maintenance | Requires accurate revenue and cost data |
| Best For | Service businesses, contractors, agencies, wholesalers, professional services and recurring customer businesses |
| Primary Output | Customer profitability visibility and human review alerts |
The Hidden Revenue Leak
| Without This Blueprint | With This Blueprint |
|---|---|
| Revenue is mistaken for profitability | Revenue is compared with attributable cost |
| High spending customers appear automatically valuable | Customer economics can be examined individually |
| Excess labor disappears inside payroll | Labor can be associated with the work creating it |
| Rework and service demands remain disconnected | Cost drivers become more visible |
| Discounts are evaluated individually | Their cumulative margin effect can be examined |
| Owners discover weak accounts through intuition | Defined thresholds create consistent review |
| Decisions happen after margins deteriorate | Warning signals can appear earlier |
The economic leak is continuing to serve customers without understanding whether the relationship generates enough gross profit or contribution margin to justify the resources it consumes.
This does not mean every low margin customer should be removed.
A customer might temporarily produce weak margins because of an unusual project.
A new account might have unusually high onboarding costs.
A strategically important customer could produce indirect value the calculation does not capture.
A pricing mistake may be the real problem.
An inefficient internal process may be responsible rather than the customer.
The system therefore detects an economic condition requiring investigation.
It does not make the final customer decision.
Business Impact Snapshot
| Area | Potential Impact |
|---|---|
| Margin Visibility | Revenue and attributable costs become easier to compare |
| Pricing | Underpriced customer relationships become easier to investigate |
| Labor | Excessive service time becomes more visible |
| Operations | Rework and unusual servicing costs can surface |
| Customer Management | Managers can prioritize accounts requiring review |
| Decision Making | Decisions rely more on economics and less on revenue alone |
| Scalability | The same profitability rules can monitor a larger customer base |
Real World Example
A commercial landscaping company has two customers.
Customer A
Monthly Revenue: $8,000
Direct Labor: $3,000
Materials: $1,500
Travel And Equipment: $500
Rework: $250
Estimated Contribution: $2,750
Customer B
Monthly Revenue: $10,000
Direct Labor: $5,000
Materials: $2,000
Travel And Equipment: $900
Rework And Additional Visits: $1,400
Estimated Contribution: $700
Customer B generates more revenue.
But Customer A contributes substantially more toward the business after the tracked costs of servicing the account.
Without profitability visibility, Customer B might appear more important simply because its invoices are larger.
The detection system identifies the unusual margin and sends it for review.
The manager may discover that Customer B’s contract was priced using an outdated labor estimate.
The correct response might therefore be repricing the work rather than ending the customer relationship.
That distinction is important.
The system identifies the financial problem. A person determines why it exists.
WIZESTAX Stax Options
Starter Stax
QuickBooks Online
Best For
Businesses where most customer revenue and job costs already live inside their accounting system.
| Function | Software |
|---|---|
| Customer Revenue | QuickBooks Online |
| Project Revenue | QuickBooks Online |
| Project Expenses | QuickBooks Online |
| Labor Costs | QuickBooks Online |
| Profitability Reporting | QuickBooks Online |
| Financial Review | QuickBooks Online |
QuickBooks Online Projects can group estimates, income, expenses and other transactions around a customer project. QuickBooks Online Plus and Advanced can use Projects to track income and costs and monitor project profitability. (QuickBooks)
Advantages
| Benefit |
|---|
| Financial information remains close to the accounting records |
| Useful for job and project based businesses |
| Revenue and direct costs can be viewed together |
| Reduces the need to create a separate profitability database |
| Good starting point when customer economics are relatively straightforward |
Limitations
| Limitation |
|---|
| Requires disciplined cost allocation |
| Some indirect service costs may remain outside the project |
| Customer profitability can involve several projects |
| Nonfinancial customer behavior may live elsewhere |
| Advanced detection may require additional reporting or automation |
Growth Stax
HubSpot
Best For
Businesses that want profitability indicators connected to CRM customer records and operational workflows.
| Function | Software |
|---|---|
| Customer Records | HubSpot |
| Revenue Properties | HubSpot |
| Cost Properties | HubSpot |
| Calculations | HubSpot |
| Segmentation | HubSpot |
| Workflow Alerts | HubSpot |
| Human Review | HubSpot |
HubSpot supports custom properties for business specific information, while calculation properties can use record properties and rollups can aggregate associated record values. These capabilities vary by subscription. (HubSpot Knowledge Base)
Advantages
| Benefit |
|---|
| Profitability signals can sit beside customer information |
| Customer owners can receive internal alerts |
| Useful for recurring customer relationships |
| Thresholds can trigger structured workflows |
| Financial signals can interact with customer management processes |
Limitations
| Limitation |
|---|
| Reliable cost data must reach the CRM |
| Advanced calculations depend on subscription |
| CRM data is not a substitute for accounting records |
| Cost allocation can become complex |
| Financial conclusions require human validation |
Pro Stax
Zoho Analytics
Best For
Businesses that need to combine customer, sales, billing, operational, or service information from multiple systems.
| Function | Software |
|---|---|
| Data Integration | Zoho Analytics |
| Revenue Analysis | Zoho Analytics |
| Cost Analysis | Zoho Analytics |
| Customer Segmentation | Zoho Analytics |
| Dashboards | Zoho Analytics |
| Trend Analysis | Zoho Analytics |
| Management Reporting | Zoho Analytics |
Zoho Analytics provides CRM analytics capabilities and supports reporting across business data, making it better suited to situations where profitability analysis requires information beyond a single CRM or accounting record. (Zoho Corporation)
Advantages
| Benefit |
|---|
| Stronger cross system analysis |
| Useful when revenue and costs live in different platforms |
| Can support more sophisticated profitability models |
| Better suited to larger customer populations |
| Management dashboards can expose profitability patterns |
Limitations
| Limitation |
|---|
| Greater implementation complexity |
| Data quality becomes critical |
| Requires agreement about cost allocation |
| Analytics can expose a problem without explaining its cause |
| Smaller businesses may not need this level of infrastructure |
How The Three Stax Differ
| Stax | Primary Approach |
|---|---|
| QuickBooks Online | Measure profitability close to accounting and project records |
| HubSpot | Monitor profitability indicators inside customer relationship workflows |
| Zoho Analytics | Analyze customer profitability across multiple business systems |
These are different architectures rather than rankings.
QuickBooks is appropriate when customer economics can be understood primarily through project income and costs.
HubSpot becomes useful when profitability signals need to interact with account ownership and customer workflows.
Zoho Analytics addresses businesses where determining profitability requires information from several systems.
Copy And Paste Internal Alert
Subject: Customer Profitability Review Required
“{{customer_name}} has crossed the approved profitability review threshold.
Revenue Reviewed: {{customer_revenue}}
Tracked Service Cost: {{tracked_cost}}
Estimated Contribution: {{estimated_contribution}}
Estimated Margin: {{estimated_margin}}
Primary Cost Driver: {{cost_driver}}
Please review the underlying transactions and operating activity before making any customer, pricing, or service decision.”
Copy And Paste AI Prompt
You are assisting a business with customer profitability analysis.
Your job is to identify customer relationships that require financial review.
Use only verified revenue, cost, labor, transaction, project, service, and customer information supplied by the business.
Do not assume that revenue equals profit.
Do not invent costs.
Do not estimate missing labor unless an approved calculation method has been provided.
Do not assign arbitrary overhead.
Do not assume a customer should be removed because profitability is low.
Do not describe a customer as bad, difficult, or undesirable based only on financial results.
When sufficient data exists, calculate the approved profitability measure exactly as instructed.
Identify the largest verified cost drivers contributing to weak profitability.
Possible drivers may include labor, materials, travel, discounts, rework, returns, support activity, special handling, or other approved cost categories.
Separate verified facts from possible explanations.
If important cost information is missing, label the result incomplete rather than estimating it.
If profitability falls below the approved review threshold, flag the customer for human review.
The goal is to identify economic relationships that deserve investigation, not automatically decide how the business should treat the customer.
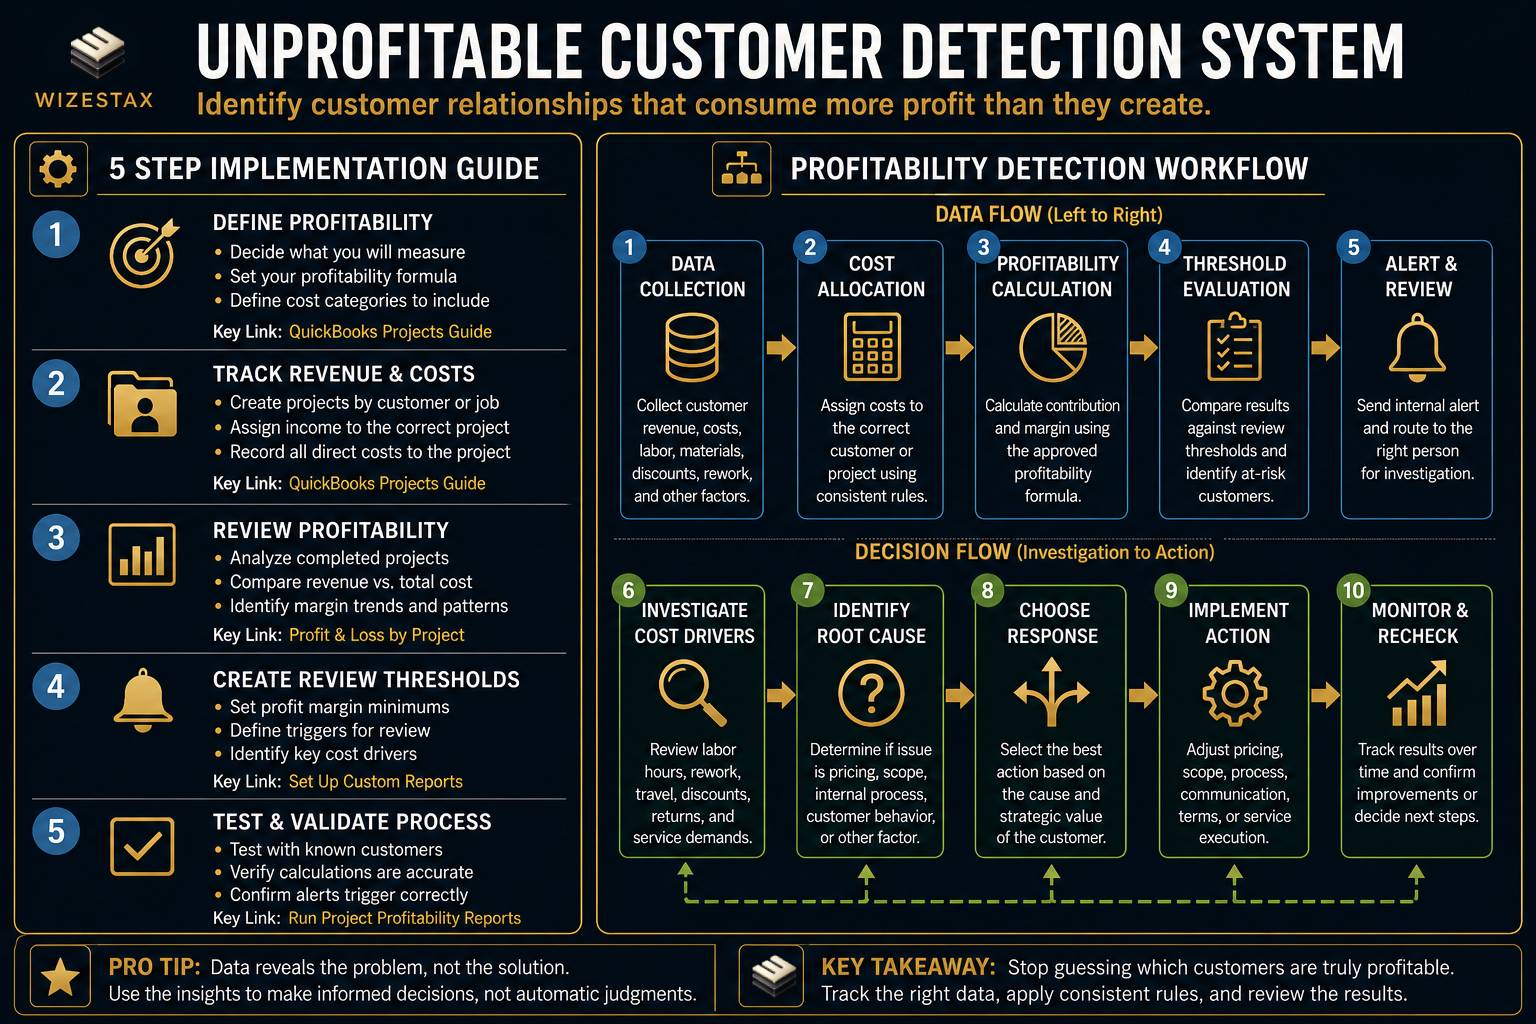
Step By Step Implementation Guide
The following setup demonstrates one implementation path using QuickBooks Online Projects.
It is not a WIZESTAX recommendation or preferred Stax.
QuickBooks is used because the implementation keeps revenue and attributable job costs close to the underlying accounting records.
Step 1: Define Profitability
Before building the system, decide what the business is actually measuring.
A basic model might use:
Customer Revenue
minus
Direct Labor
minus
Materials
minus
Other Direct Service Costs
equals
Customer Contribution
The business may choose a more sophisticated model.
The important requirement is consistency.
Do not mix different profitability definitions across customers and then compare the results as though they measure the same thing.
Step 2: Track Revenue And Costs By Customer Or Project
Create projects for the work being evaluated and associate the appropriate customer.
Assign relevant transactions to those projects.
QuickBooks Projects allows businesses to group customer specific transactions and track income and costs for individual projects. (QuickBooks)
Include only costs the business has deliberately decided belong in the profitability calculation.
Accuracy matters more than complexity.
Step 3: Review Profitability Across Completed Work
Once revenue and expenses have been recorded, review project profitability.
Look beyond a single unusual job.
A customer relationship may include multiple projects, service visits, or recurring transactions.
Useful measures can include:
Total Revenue
Direct Cost
Contribution
Contribution Margin
Average Profitability Per Job
Rework Cost
Additional Service Visits
Discounts
The objective is to identify patterns rather than punish one unusual transaction.
Step 4: Create Review Thresholds
Define when a customer requires investigation.
Examples might include:
Contribution Margin Below Approved Minimum
Negative Contribution During The Review Period
Repeated Unprofitable Projects
Rapid Margin Decline
Unexpected Labor Cost
Repeated Rework Cost
Do not make the threshold an automatic customer termination rule.
Instead:
Threshold Crossed
↓
Customer Flagged
↓
Financial Data Reviewed
↓
Cost Driver Identified
↓
Human Decision
Possible responses could include correcting internal inefficiency, adjusting scope, changing pricing, reducing unnecessary service work, renegotiating terms, or deciding that the relationship no longer fits the business.
Step 5: Test The Complete Detection Process
Select several known customer relationships.
Test a clearly profitable customer.
Test a marginal customer.
Test a customer with unusually high labor.
Test a customer with substantial material costs.
Test a customer with incomplete data.
Test a customer containing an unusual one time project.
Confirm that the calculation uses the correct revenue and cost records.
Then verify that incomplete information does not produce a confident profitability conclusion.
The system is ready when a weak profitability signal reliably leads to financial investigation rather than an automatic customer judgment.
Customer Profitability Snapshot
Consider an illustrative business reviewing customer economics.
| Customer Revenue | Tracked Service Cost | Contribution | Contribution Margin |
|---|---|---|---|
| $5,000 | $3,000 | $2,000 | 40% |
| $10,000 | $8,500 | $1,500 | 15% |
| $15,000 | $15,500 | Negative $500 | Negative 3.3% |
These numbers are illustrative.
They do not establish what an acceptable margin should be for any particular business or industry.
Different businesses have different overhead structures, pricing models, strategic objectives, service requirements, and margin expectations.
The purpose of the system is to reveal differences that were previously difficult to see.
Useful measurements include:
Customer Revenue
How much revenue the customer generated.
Tracked Customer Cost
How much attributable cost was recorded.
Customer Contribution
Revenue minus the approved tracked costs.
Contribution Margin
Contribution divided by customer revenue.
Labor Cost
Labor associated with serving the customer.
Rework Cost
Cost associated with correcting previous work.
Margin Trend
Whether customer economics are improving or deteriorating.
Incomplete Cost Records
Customers where profitability cannot yet be calculated reliably.
WIZESTAX Diagnostic Scorecard
| Category | Assessment |
|---|---|
| Economic Problem | Customer revenue can conceal relationships that consume excessive business resources |
| Financial Data Accuracy Required | Very High |
| Automation Potential | Moderate To High |
| Human Judgment Required | Very High |
| Customer Effort | None |
| Timing Dependency | Moderate |
| Financial Sensitivity | Very High |
| Scalability | High |
| Primary Value | Visibility into customer level economics |
| Primary Risk | Making customer decisions from incomplete or incorrectly allocated cost data |
Common Mistakes
| Mistake | Result |
|---|---|
| Measuring revenue instead of profitability | High revenue customers appear automatically valuable |
| Ignoring labor | Service intensive customers look more profitable than they are |
| Allocating costs inconsistently | Customer comparisons become unreliable |
| Treating one unusual project as a permanent pattern | Normal variation creates false alarms |
| Automatically firing low margin customers | The underlying business problem remains unidentified |
| Ignoring internal inefficiency | Customers are blamed for operational problems |
| Guessing missing costs | Profitability calculations become misleading |
| Using the same margin target for every service | Different economics are treated as identical |
| Ignoring strategic value | Financial data becomes the only decision factor |
| Failing to investigate the cost driver | Detection occurs without useful diagnosis |
Related WIZESTAX Categories
| Category | Related Business Problem |
|---|---|
| Finance | Underpriced Service Detection |
| Finance | Job Profit Margin Warning |
| Operations | Scope Creep Detection |
| Operations | Job Cost Overrun Warning |
| Operations | Job Rework Detection |
| Customer Retention | Customer Spend Decline Warning |
| Marketing | Customer Acquisition Cost Tracking |
These systems solve different problems. The Unprofitable Customer Detection System asks whether the overall economics of serving a customer have become weak or negative. Underpriced Service Detection asks whether the underlying service price is systematically too low. Job Profit Margin Warning examines the economics of an individual job. Job Cost Overrun Warning detects costs exceeding expectations while work is underway. Scope Creep Detection identifies work expanding beyond the agreed scope. Job Rework Detection identifies repeated corrective work. Customer Spend Decline Warning detects falling customer spending rather than profitability. Customer Acquisition Cost Tracking measures what it costs to acquire customers rather than what it costs to serve them. The distinction matters because a customer can be highly profitable even if one job performs poorly, and an unprofitable customer relationship can exist even when individual invoices appear healthy.
Get New WIZESTAX Blueprints Every Monday
Subscribe to receive new WIZESTAX Blueprints covering Finance, Operations, Customer Retention, Marketing and Sales directly to your inbox.