Promotion Profitability Tracking System
Measure Whether Discounts and Promotions Create Enough Profit to Justify the Revenue They Generate
Promotions can make a sales report look successful while leaving the business with less profit than expected. A discount may increase order volume, bring inactive customers back or move inventory faster. It can also reduce margin on purchases customers might have made anyway, increase advertising costs or concentrate sales around lower margin products.
The Promotion Profitability Tracking System connects promotional activity with sales, discounts and product costs so the business can evaluate what remained after the promotion generated revenue.
The purpose is not to classify discounts as good or bad. It is to separate sales generated during a promotion from the economics of the promotion itself.
This Blueprint owns one distinct leak: promotional revenue increases while the cost of generating those sales quietly reduces or eliminates the economic benefit.
Which Stax Fits Your Business
| Business Need | Stax | Software | Cost |
|---|---|---|---|
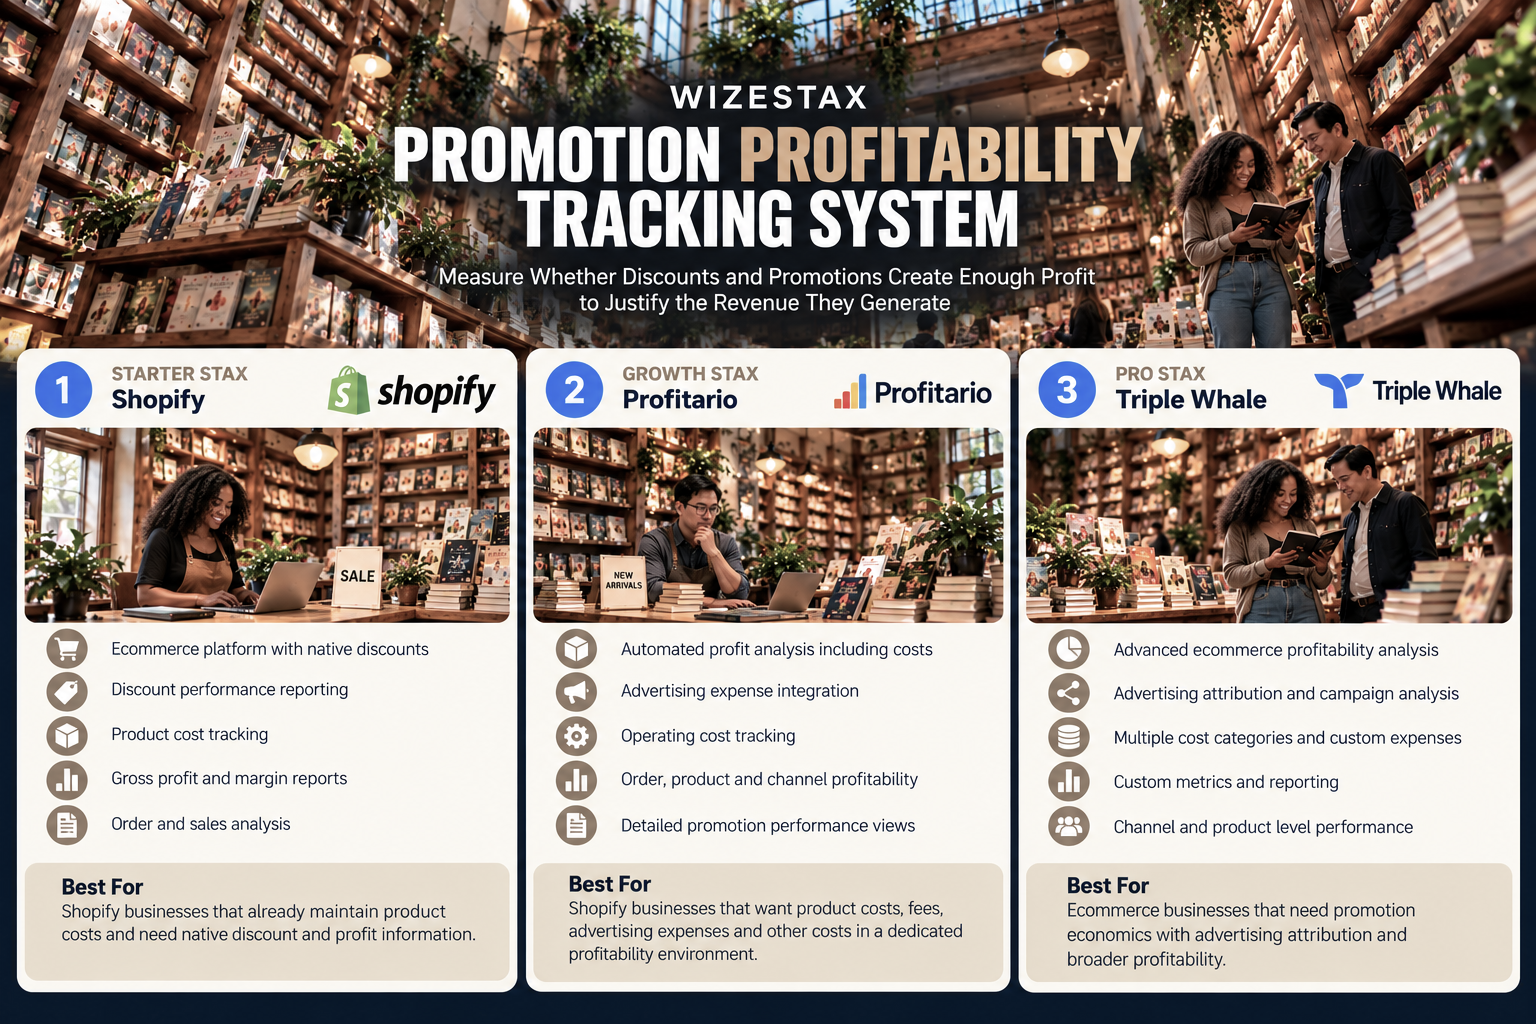
| Native discount and profit reporting inside an ecommerce store | Starter Stax | Shopify | Varies by plan |
| Automated profit analysis including costs and advertising | Growth Stax | Profitario | Free and paid plans available |
| Advanced ecommerce profitability and attribution analysis | Pro Stax | Triple Whale | Varies by plan and usage |
Pricing and capabilities change over time and should be confirmed directly with each software provider before purchase.
Software Linx
Starter: Shopify
Growth: Profitario
Pro: Triple Whale
Blueprint Overview
| Metric | Value |
|---|---|
| Category | Marketing |
| Business Problem | Promotions can increase sales while reducing margin enough to weaken their economic value |
| Primary Objective | Measure promotional performance using profit context rather than revenue alone |
| Core Signals | Gross sales, discounts, net sales, product costs, order volume, refunds and promotional costs |
| Setup Time | Approximately 60 to 120 minutes |
| Difficulty | Intermediate |
| Maintenance | Review after each material promotion |
| Best For | Businesses regularly using discounts, coupon codes, sales or promotional campaigns |
| Primary Output | Promotion profitability status and investigation trigger |
The Hidden Revenue Leak
| Without This Blueprint | With This Blueprint |
|---|---|
| Promotions are judged mainly by revenue | Revenue receives margin and cost context |
| Increased orders can appear automatically successful | Profitability is reviewed separately from volume |
| Discount expense is easy to overlook | Discount value becomes visible |
| Product costs remain disconnected from campaigns | Cost information can be included |
| High revenue promotions can hide weak margins | Promotion economics receive direct review |
| Future promotions repeat without a baseline | Results create comparable historical evidence |
Shopify’s current discount reporting can show performance by discount alongside measures including orders and net sales. Its profit reporting separately incorporates product costs and calculates gross profit from net sales and cost. Discounts and refunds affect the resulting margin. Shopify
Business Impact Snapshot
| Area | Potential Impact |
|---|---|
| Profitability | Promotions can be evaluated beyond topline sales |
| Pricing | Discount depth receives economic context |
| Marketing | Campaign activity can be compared with actual business outcomes |
| Inventory | Clearance activity can be evaluated against the margin surrendered |
| Planning | Future promotions gain a historical baseline |
| Management | Revenue growth and profit growth remain separate measures |
Real World Example
An ecommerce business normally sells a product for $100 with a $55 product cost.
During a promotion, the price falls to $80.
Normal gross profit before other expenses is $45 per unit. During the promotion it falls to $25.
The promotion increases sales from 100 units to 160 units.
At full price, 100 units would produce $10,000 in sales and $4,500 in gross profit.
During the promotion, 160 units produce $12,800 in sales and $4,000 in gross profit before considering advertising or other promotional costs.
Revenue increased by $2,800 and unit volume increased substantially, yet gross profit in this simplified example declined by $500.
That does not automatically mean the promotion failed. It may have acquired valuable new customers, cleared inventory or produced later purchases.
It does show why revenue alone cannot establish whether a promotion was economically successful.
WIZESTAX Stax Options
Starter Stax
Shopify
Best For
Shopify businesses that already maintain product costs and primarily need native discount, sales and gross profit information.
| Function | Software |
|---|---|
| Ecommerce | Shopify |
| Promotion Setup | Shopify Discounts |
| Discount Reporting | Shopify Analytics |
| Product Costs | Cost Per Item |
| Profit Analysis | Shopify Profit Reports |
| Order Analysis | Shopify Reports |
Shopify supports percentage discounts, fixed discounts, free shipping and other promotional configurations. Its reporting can provide discount level performance, while profit reports use recorded product costs to calculate gross profit and margin. Shopify
Advantages
| Benefit |
|---|
| Promotion and sales information remain in the commerce environment |
| Discount performance can be reviewed individually |
| Product costs can provide gross profit context |
| No separate analytics platform is required for basic analysis |
| Historical reports can support comparison between promotions |
Limitations
| Limitation |
|---|
| Profit reporting depends on accurate product costs |
| Gross profit does not automatically represent complete business profit |
| Advertising and other promotional expenses may require additional analysis |
| Missing historical cost information can weaken reports |
| Increased sales do not establish incremental sales caused by the promotion |
Shopify notes that profit is reported only for products that had cost information recorded when they were sold. Shopify Help Center
Growth Stax
Profitario
Best For
Shopify businesses that want product costs, fees, advertising expenses and other costs brought into a dedicated profitability environment.
| Function | Software |
|---|---|
| Store Data | Shopify Integration |
| Product Costs | COGS Tracking |
| Advertising | Ad Cost Integration |
| Expenses | Operating Cost Tracking |
| Profitability | Net Profit Dashboard |
| Analysis | Product And Channel Reporting |
Profitario describes its Shopify application as a profit analytics environment combining store activity with COGS, advertising, shipping, fees and other expenses to calculate profit at order, product and channel levels. Shopify App Store
Advantages
| Benefit |
|---|
| More costs can be included than product cost alone |
| Advertising expense can participate in profitability analysis |
| Order and product profitability can be reviewed |
| Automated calculations reduce spreadsheet work |
| Promotions can be examined within broader store economics |
Limitations
| Limitation |
|---|
| Primarily designed around Shopify |
| Accuracy depends on complete cost information |
| Promotion identification still needs consistent tagging or discount data |
| Shared business expenses may require allocation rules |
| Reported profit does not establish how much demand was caused by the promotion |
Pro Stax
Triple Whale
Best For
Ecommerce businesses that need promotion economics viewed alongside advertising attribution, product costs and broader profitability.
| Function | Software |
|---|---|
| Ecommerce Analytics | Triple Whale |
| Product Costs | COGS |
| Advertising Costs | Connected Ad Platforms |
| Additional Expenses | Cost Settings |
| Attribution | Triple Pixel |
| Profitability | Summary And Custom Metrics |
Triple Whale allows businesses to enter COGS, shipping, payment gateway costs and custom expenses, then use that information in profitability dashboards and custom metrics. Its attribution environment can also analyze performance at channel, campaign and ad levels. Triple Whale Help Center
Advantages
| Benefit |
|---|
| Multiple cost categories can participate in profitability analysis |
| Advertising performance can be viewed with profit context |
| Custom metrics allow businesses to define relevant measures |
| Attribution provides additional context around promotional campaigns |
| Suitable for stores with more complex marketing activity |
Limitations
| Limitation |
|---|
| More setup and data maintenance are required |
| Cost accuracy directly affects profitability calculations |
| Attribution models can produce different interpretations |
| Advanced functionality may exceed the needs of smaller stores |
| Attribution still cannot perfectly establish what would have happened without the promotion |
Triple Whale specifically cautions that some attribution models can duplicate credited revenue across channels and should not be used as total financial reporting views. Triple Whale Help Center
How The Three Stax Differ
| Stax | Primary Approach |
|---|---|
| Shopify | Native discount, sales and gross profit reporting |
| Profitario | Automated ecommerce profit tracking across additional cost categories |
| Triple Whale | Advanced profitability combined with marketing attribution |
These are different implementation architectures rather than rankings.
The appropriate architecture depends on how many costs the business needs to include, whether advertising is part of the promotion and how sophisticated the marketing measurement environment needs to become.
Copy And Paste Promotion Profitability Review
Promotion review for {{promotion_name}} during {{period}}. Recorded gross sales were {{gross_sales}}, discounts were {{discount_value}}, net sales were {{net_sales}} and available promotional costs were {{promotion_costs}}. Compare the result with the normal baseline and review product margin, order volume, refunds, customer mix and promotional expenses before determining whether the promotion produced enough business value.
Copy And Paste Post Promotion Review
Review {{promotion_name}} using the same measurement rules used for previous promotions. Compare revenue, discount value, units sold, gross profit and additional promotional costs where available. Identify meaningful differences from normal performance without assuming that increased revenue or order volume proves incremental profit.
Copy And Paste AI Prompt
You are assisting a small business with promotion profitability analysis.
Review the available sales, discount, product cost, advertising and expense information for the promotion.
Separate gross sales from net sales and profit.
Calculate the value of discounts where reliable information is available.
Compare promotional performance with an appropriate normal baseline.
Identify whether increased sales volume was accompanied by stronger or weaker available profit measures.
Consider product mix, refunds, advertising expense and other known promotional costs.
Do not assume that higher revenue means the promotion was profitable.
Do not assume that every purchase during the promotion was caused by the promotion.
Do not assume that a lower margin promotion was unsuccessful if it served another documented business objective.
Do not invent missing costs or customer behavior.
If the available information is insufficient to evaluate profitability, identify the additional information required.
Step By Step Implementation Guide
The following setup demonstrates one implementation path using Shopify.
It is not a WIZESTAX recommendation or preferred Stax.
Shopify is used here because its native environment provides a straightforward example of connecting discounts, orders, net sales, product costs and gross profit without requiring a separate analytics platform. Shopify
Step 1: Define The Promotion
Give each material promotion a clear identity.
Record:
Promotion Name
Start Date
End Date
Discount Type
Eligible Products
Customer Eligibility
Primary Business Objective
Do not group unrelated promotions together simply because they occurred during the same month.
Step 2: Establish The Normal Baseline
Review comparable performance before the promotion.
Depending on the business, the baseline might include:
Orders
Units Sold
Gross Sales
Net Sales
Average Order Value
Gross Profit
Avoid using an unusually strong or weak period as the comparison simply because it produces a more favorable result.
Step 3: Verify Product Costs
Confirm that cost per item information exists for the products included in the promotion.
Shopify’s profit reporting requires product cost information from the time of sale to calculate product level profit accurately. Shopify Help Center
Step 4: Configure The Promotion
Create the discount and define its rules.
Shopify currently supports percentage discounts, fixed amount discounts, free shipping and other configurations, including scheduling and minimum requirements. Shopify
Step 5: Record Additional Promotion Costs
Identify costs that may not appear in the discount report.
These could include paid advertising, creative production, affiliate commissions or special fulfillment expenses.
Keep these separate from ordinary operating expenses unless the business has a consistent allocation method.
Step 6: Run The Promotion
Allow the promotion to operate according to its defined rules.
Avoid changing the discount, audience and measurement method repeatedly during the same promotion unless the changes are documented.
Otherwise, the final result becomes difficult to interpret.
Step 7: Review Sales And Discounts
After the promotion, review:
Gross Sales
Discount Value
Net Sales
Orders
Units Sold
Returns
Shopify’s analytics includes discount and sales fields that can help evaluate promotional activity. Shopify Help Center
Step 8: Review Gross Profit
Compare the promotion’s available gross profit with the baseline.
Do not stop at revenue.
A promotion that produces more sales can still produce less gross profit if the additional volume does not compensate for reduced margin.
Step 9: Add External Promotion Costs
Where advertising or other campaign specific expenses exist, include them in a separate profitability calculation.
A simple operating view can be:
Available Promotion Contribution = Gross Profit During Promotion − Identifiable Promotion Costs
This is a management measure for the review, not a complete accounting definition of net profit.
Step 10: Record The Result
Save the promotion with the same core measures used for previous campaigns.
Over time, the business develops a promotion history rather than evaluating each sale in isolation.
The result might show that certain discounts increase profit, others primarily move inventory and others generate substantial revenue without enough remaining margin to justify repeating them.
Promotion Profit Snapshot
| Scenario | Net Sales | Product Cost | Gross Profit |
|---|---|---|---|
| Normal Period | $10,000 | $5,500 | $4,500 |
| Promotional Period | $12,800 | $8,800 | $4,000 |
| Difference | +$2,800 | +$3,300 | −$500 |
Illustrative scenario only. This simplified example excludes advertising, shipping, payment processing, taxes, returns and other expenses. It demonstrates why increased promotional revenue does not necessarily produce increased profit.
WIZESTAX Diagnostic Scorecard
| Category | Assessment |
|---|---|
| Economic Problem | Promotions can increase sales while quietly reducing the profit retained from those sales |
| Signal Quality Required | High |
| Automation Potential | Moderate To High |
| Human Judgment Required | High |
| Data Dependency | High |
| Scalability | High |
| Primary Value | Separating promotional sales performance from promotional economics |
| Primary Risk | Treating revenue growth as proof that a promotion created incremental profit |
Common Mistakes
| Mistake | Result |
|---|---|
| Measuring only promotional revenue | Margin loss remains hidden |
| Ignoring product costs | Sales appear more economically valuable than they are |
| Forgetting advertising expense | Promotion cost is understated |
| Comparing against an inappropriate baseline | Normal variation can look like promotional impact |
| Assuming every promotional order was incremental | Existing demand can be credited to the discount |
| Ignoring refunds | Final economics can be overstated |
| Changing measurement rules between promotions | Historical comparisons become unreliable |
| Automatically rejecting lower margin promotions | Inventory, acquisition or retention objectives can be overlooked |
Get New WIZESTAX Blueprints Every Monday
Subscribe to receive new WIZESTAX Blueprints covering Customer Retention, Marketing, Sales, Finance and Operations directly to your inbox.